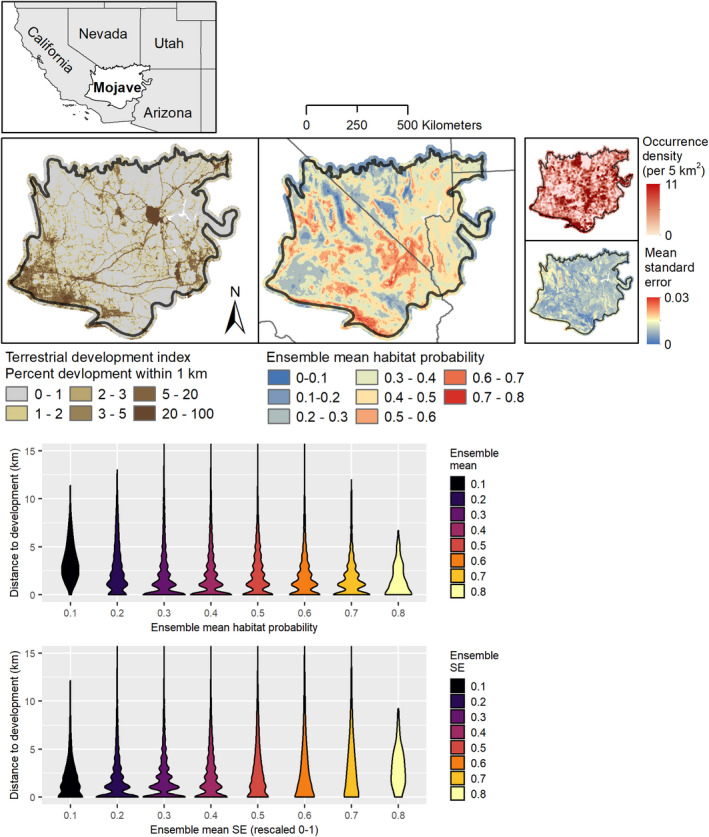
FIGURE 1.

Evaluation of systematic model bias across SDMs of Mojave Desert plants. We compared a distance‐to‐development layer calculated from the terrestrial development index (Carr & Leinwand, 2020) with aggregated habitat probabilities and aggregated model standard errors for 49 SDMs. Violin plots display the association between distance‐to‐development and aggregated habitat probabilities/standard errors (binned into eight classes). The overall density of occurrence records per square km is also displayed (top right)
