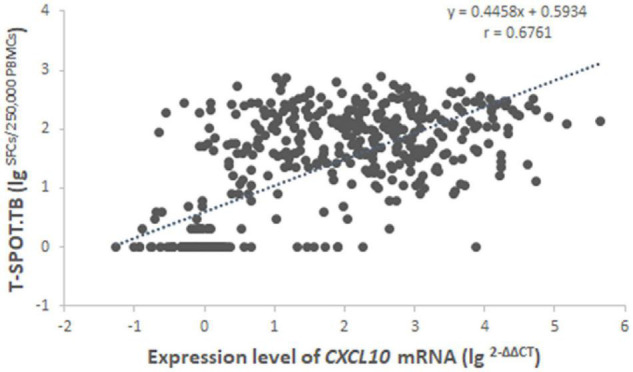
FIGURE 2.

Correlation analysis between the expression level of CXCL10 mRNA in the CXCL10 mRNA release assay and the number of SFCs in the T-SPOT.TB assay among 496 subjects with both valid results. Regression analysis was demonstrated by linear correlation (r). SFCs, spot-forming cells.
