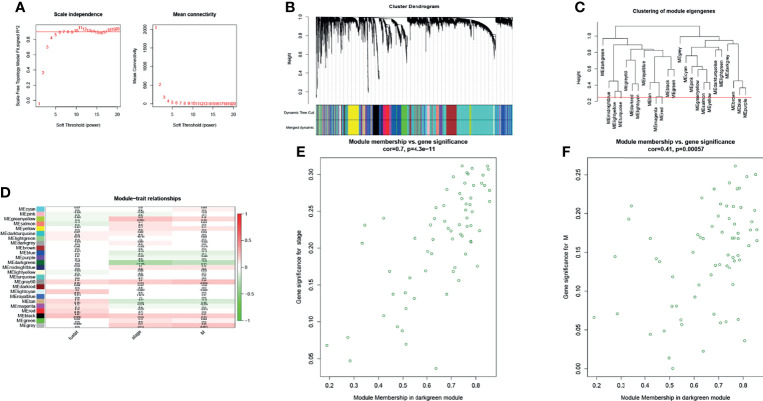
Figure 1.
The WGCNA R package was used for finding clusters (modules) of highly correlated genes. (A) Scale-free fitting index and the average connectivity at different soft threshold powers were analyzed. In summary, 5 was the most suitable power. (B) The co-expression module was created. Each branch represents a gene, and each color below represents a co-expression module. (C) Cluster dendrogram of module eigengenes. (D) Heatmap analysis of the correlation between module characteristic genes and traits showed that the dark green module negatively correlated with stage and distant metastasis of patients with CRC (absolute value of cor >0.2, p < 0.05). (E, F) Scatter plot of dark green module members (MM) and gene significance (GS). A significant correlation was found between GS and MM (cor >0.4, p < 0.0001).

