Figure 6.
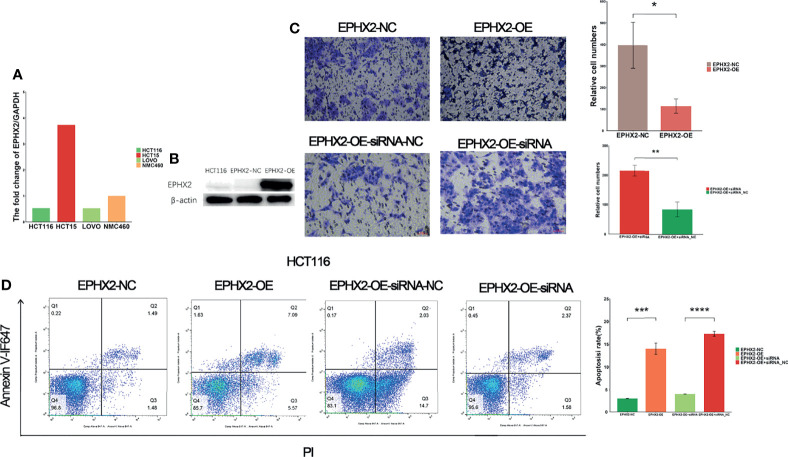
EPHX2 low expression cell line screening, cell transfection, and phenotypic determination. (A) HCT116 cells with low background expression of EPHX2 were selected for stable overexpression of EPHX2. (B) Detection of WB after stable transfection of EPHX2 overexpression into HCT116. (C) Invasion in the EPHX2 overexpression HCT116 cells was inhibited, and this effect can be reversed by EPHX2-siRNA co-transfection. ANOVA was used to compare the mean values of relative cell numbers between the two groups. *p < 0.05, **p < 0.01; original magnification, 10×; scale bars, 50 μm. (D) Cell apoptosis was promoted in EPHX2 overexpression group, and co-transfection with siRNA can reverse this effect. Statistical significance was determined with ANOVA. ***p < 0.001, ****p < 0.0001.

