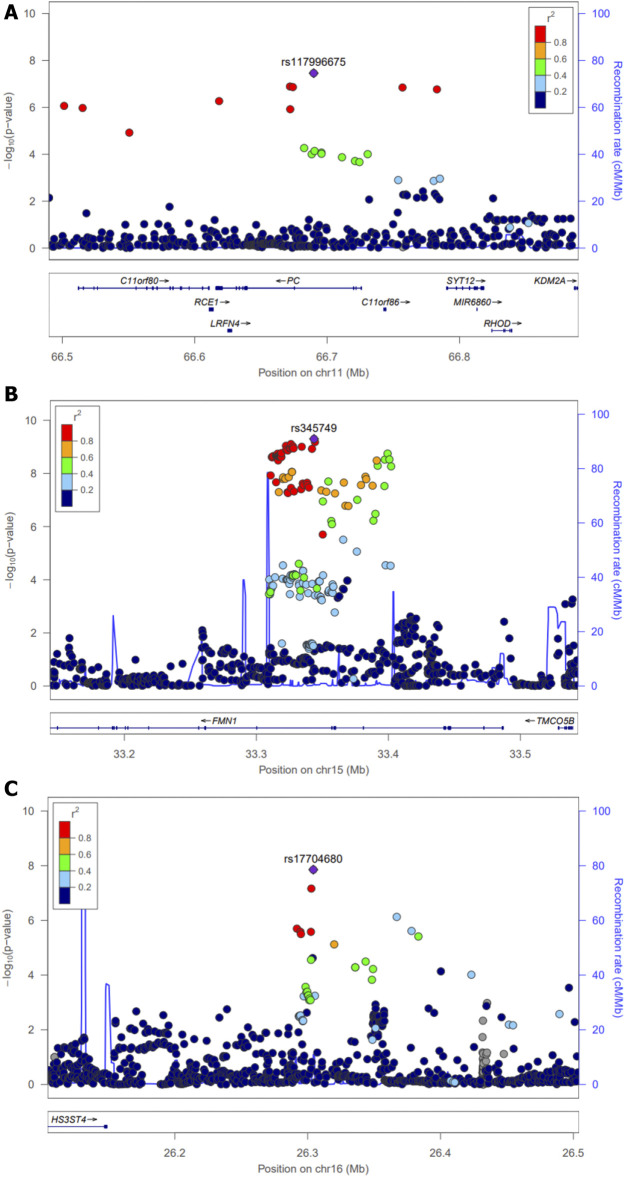
FIGURE 3.
Regional association plots for three novel loci across a 0.5-Mb window. Interaction (p-values) of individual SNPs in G×multiE interaction analysis was plotted as −log10(P) against the chromosomal base pair position (hg19). The y-axis on the right shows the recombination rate, estimated from the 1,000 Genomes EUR population. The purple diamonds indicate individual lead SNPs. Regional plots around (A) rs117996675 (B) rs345749, and (C) rs17704680.

