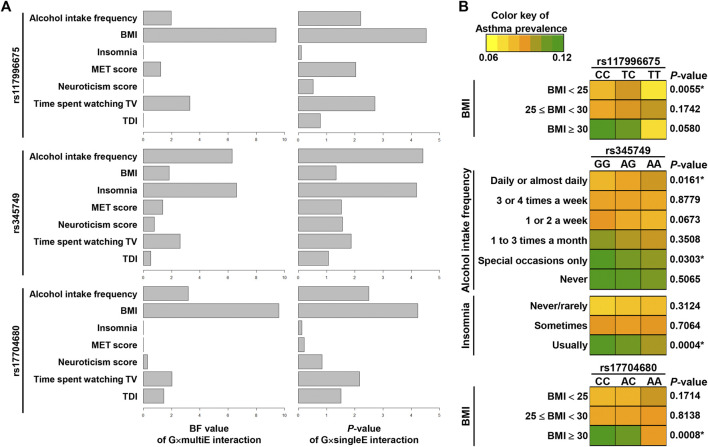
FIGURE 5.
Relevance of environmental factors in G×E interaction effects of three SNPs. (A) Graphs in the left show BF values per an environmental factor via G×multiE interaction (StructLMM), whereas those in the right show p-values [−log10(P)] by G×singleE interaction analysis for 3SNPs. (B) Asthma prevalence was visualized by heat maps, differentiated by alleles of three SNPs. p-values are the result of chi-squared test with p-values (*) of < 0.05 indicating significance.

