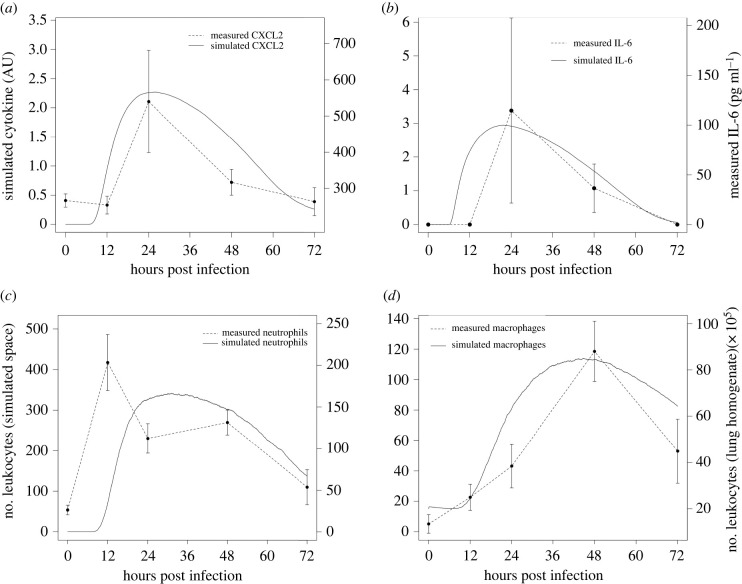
Figure 5.
Comparison of our experimental data on immunocompetent mice with simulation results. For this purpose, 36 simulations were performed, starting with an average of 1920 conidia, 15 macrophages and 640 epithelial cells. (a) Comparison of simulated time series of CXCL2 with experimental data measured in BAL. (b) Comparison of simulated time series of IL-6 with experimental data measured in BAL. (c) Comparison of the number of neutrophils in the simulated space with the number of neutrophils in lung homogenate. (d) Comparison of the number of macrophages/monocytes in simulated space with the number of monocytes in lung homogenate. Experimental data refer to mice infected with 7 × 10⁶ conidia.

