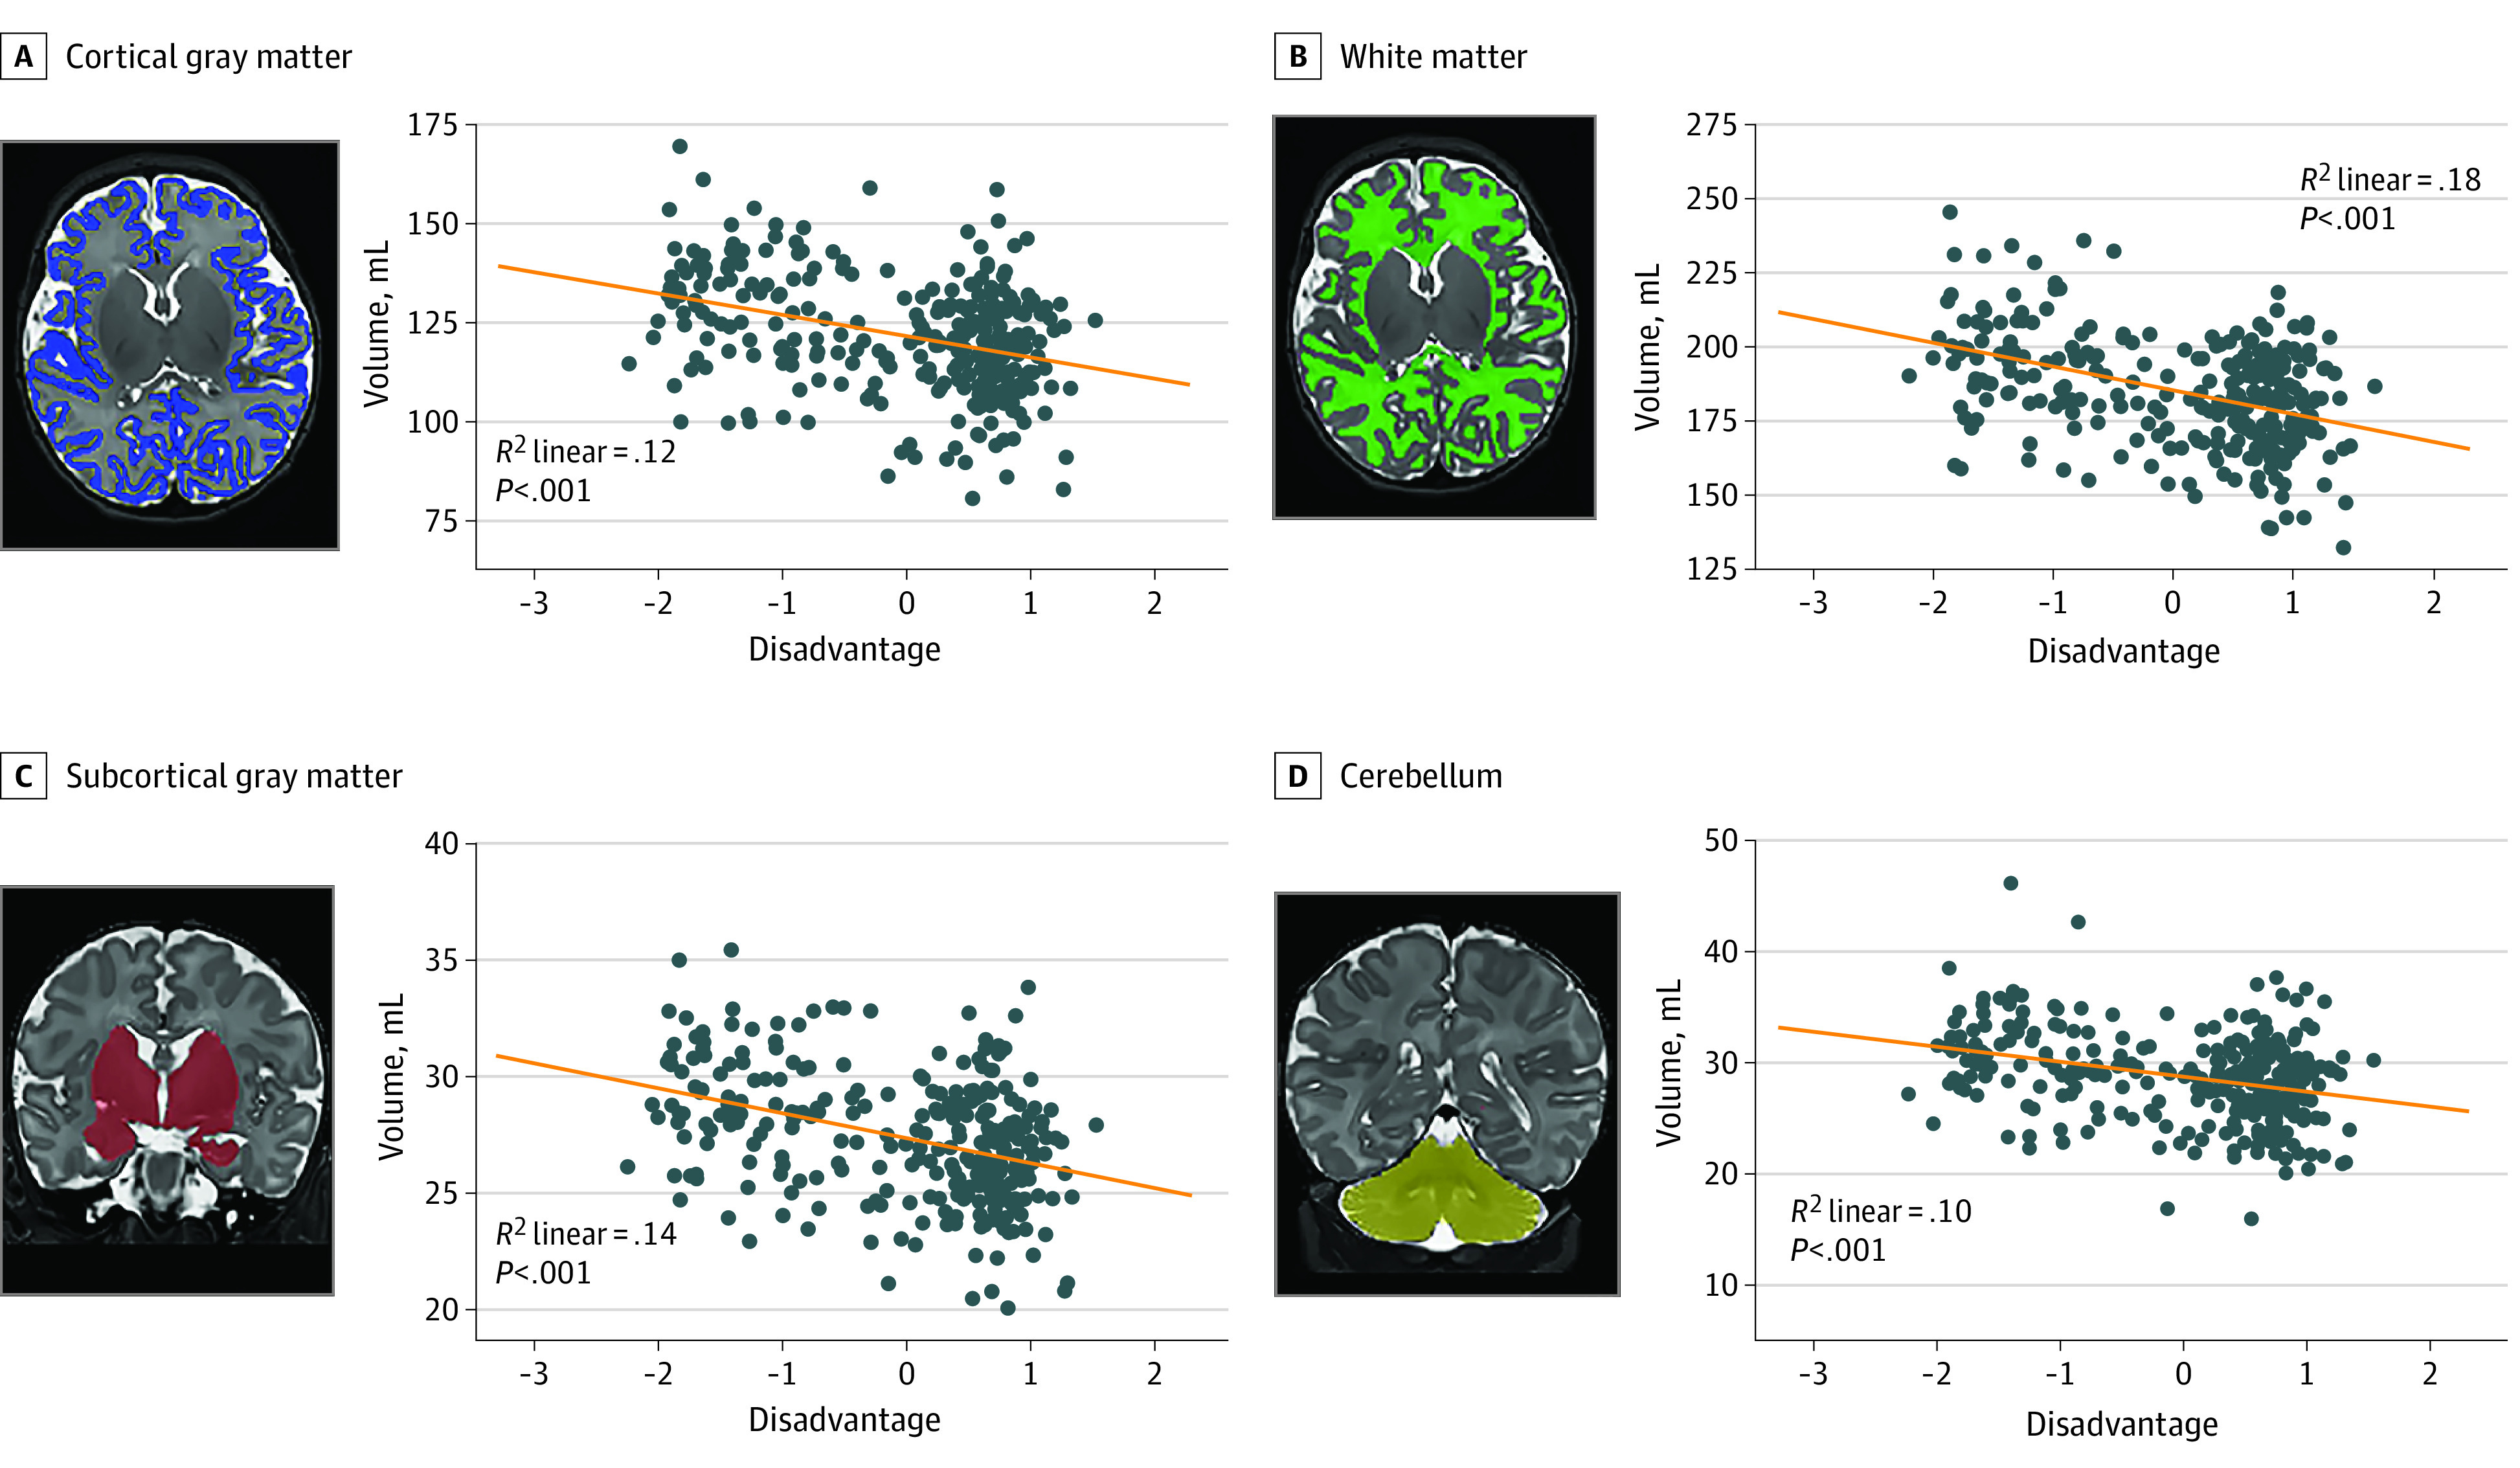
Figure 1. Correlation Between Total Brain Volume and Maternal Social Disadvantage Factor .

Correlation and P values are included for line of best fit. Automated volumetric segmentation for each tissue type is overlaid on T2-weighted image for a representative infant. X-axis indicates maternal social disadvantage.
