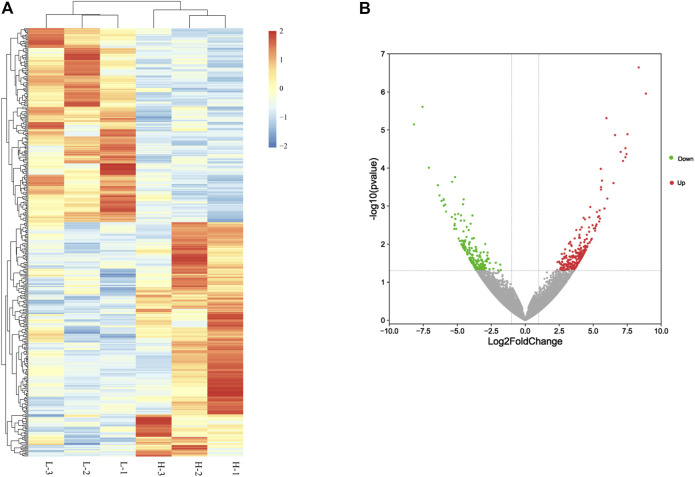
FIGURE 1.
Differentially expressed genes between high– and low–egg-yielding groups of Taihang chicken. (A) Hierarchical clusters of differentially expressed genes. H represents the high–egg-producing group and L represents the low–egg-producing group. (B) Volcano plot of differentially expressed genes in chicken small yellow follicles. Red dots represent upregulated genes and green dots represent downregulated genes.

