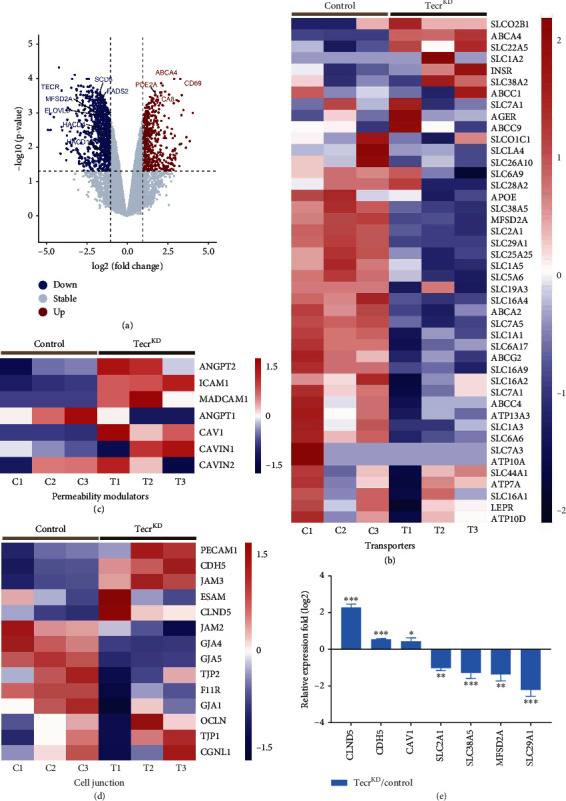
Figure 4.

Key signaling pathways governed the barrier function. (a) Volcano plots were used to display the magnitude of the differential expression between control and TecrKD ECs. n = 3 per group. (b)–(d) Heatmap showed the expression level of EC transporters-related genes (b), permeability-related genes (c), and cell-to-cell junction-related genes (d), compared with control and TecrKD ECs. (e) Representative of BBB-related genes from transcriptome analysis was reconfirmed by RT-qPCR. ∗∗∗p < 0.001, ∗∗p < 0.01, ∗p < 0.05. Data are expressed as mean ± SEM. Unpaired Student's t-test.
