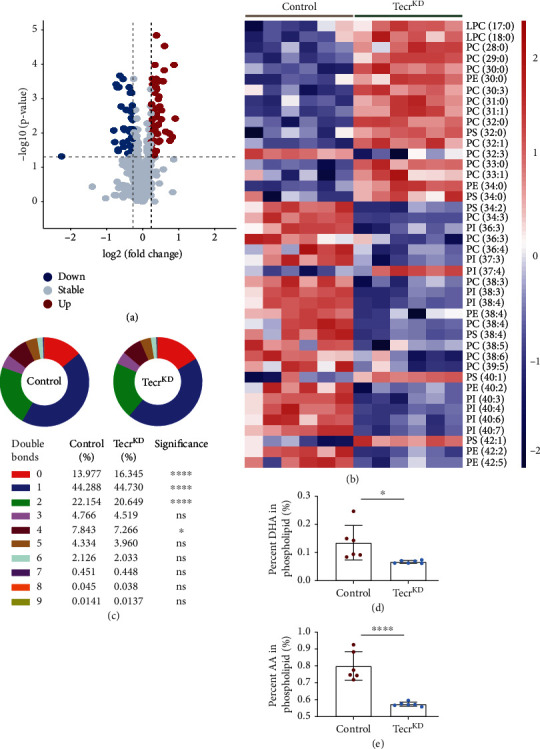
Figure 6.

Effect of Tecr knockdown on synthesis and transport of phospholipids in primary HUVECs. (a) The volcano plots visualized the different lipid molecules between control and TecrKD ECs. n = 6 per group. (b) The effect of Tecr on elongating FAs was analyzed by targeted lipidomic between control and TecrKD ECs. (c) The effect of Tecr on desaturating FAs was analyzed by targeted lipidomic between control and TecrKD ECs. ∗∗∗∗p < 0.0001, ∗p = 0.0264, unpaired t-test. (d, e) Total DHA levels (d) and total AA (e) levels in control and TecrKD ECs. DHA and AA levels were expressed as mean ± SEM of the percentage of total phospholipids. (d) p = 0.022; (e) p < 0.0001; unpaired t-test. Data are expressed as mean ± SEM.
