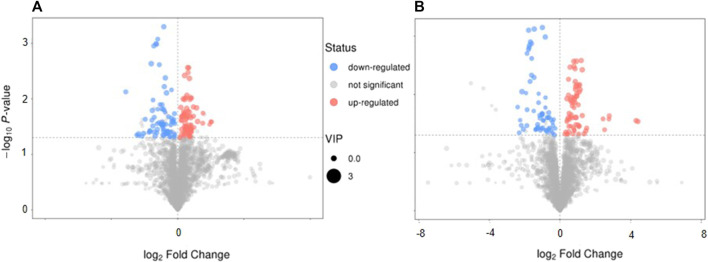
FIGURE 5.
The characteristics and pathway of serum metabolites. (A,B) Volcano map in positive-ion model and in negative-ion model, respectively. (C,D) The different metabolites pathway related with SAE were confirmed, in positive ion model and in negative ion model, respectively. Red: up-regulation, blue: down-regulation, gray: not significant, *p < 0.05.

