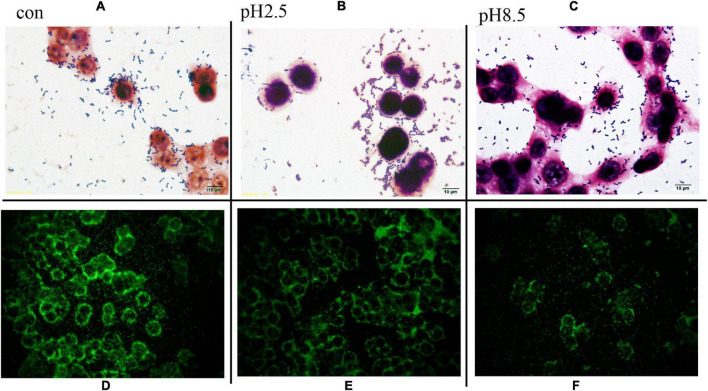
FIGURE 5.
L. plantarum RS-09 adhesion assay on HT-29 cells under different pH stress. (A–C) Adhesion observation by Gram stain. Scale bars, 10 μm (insert, 1,000×). (D–F) Fluorescence microscopic to analyze L. plantarum RS-09 adhesion on HT-29 cells. In each case, same number of Lactobacillus cells (1 × 10⁸ CFU/mL) were applied and treated equally. Scale bars, 20 μm (original magnification, 400×).

