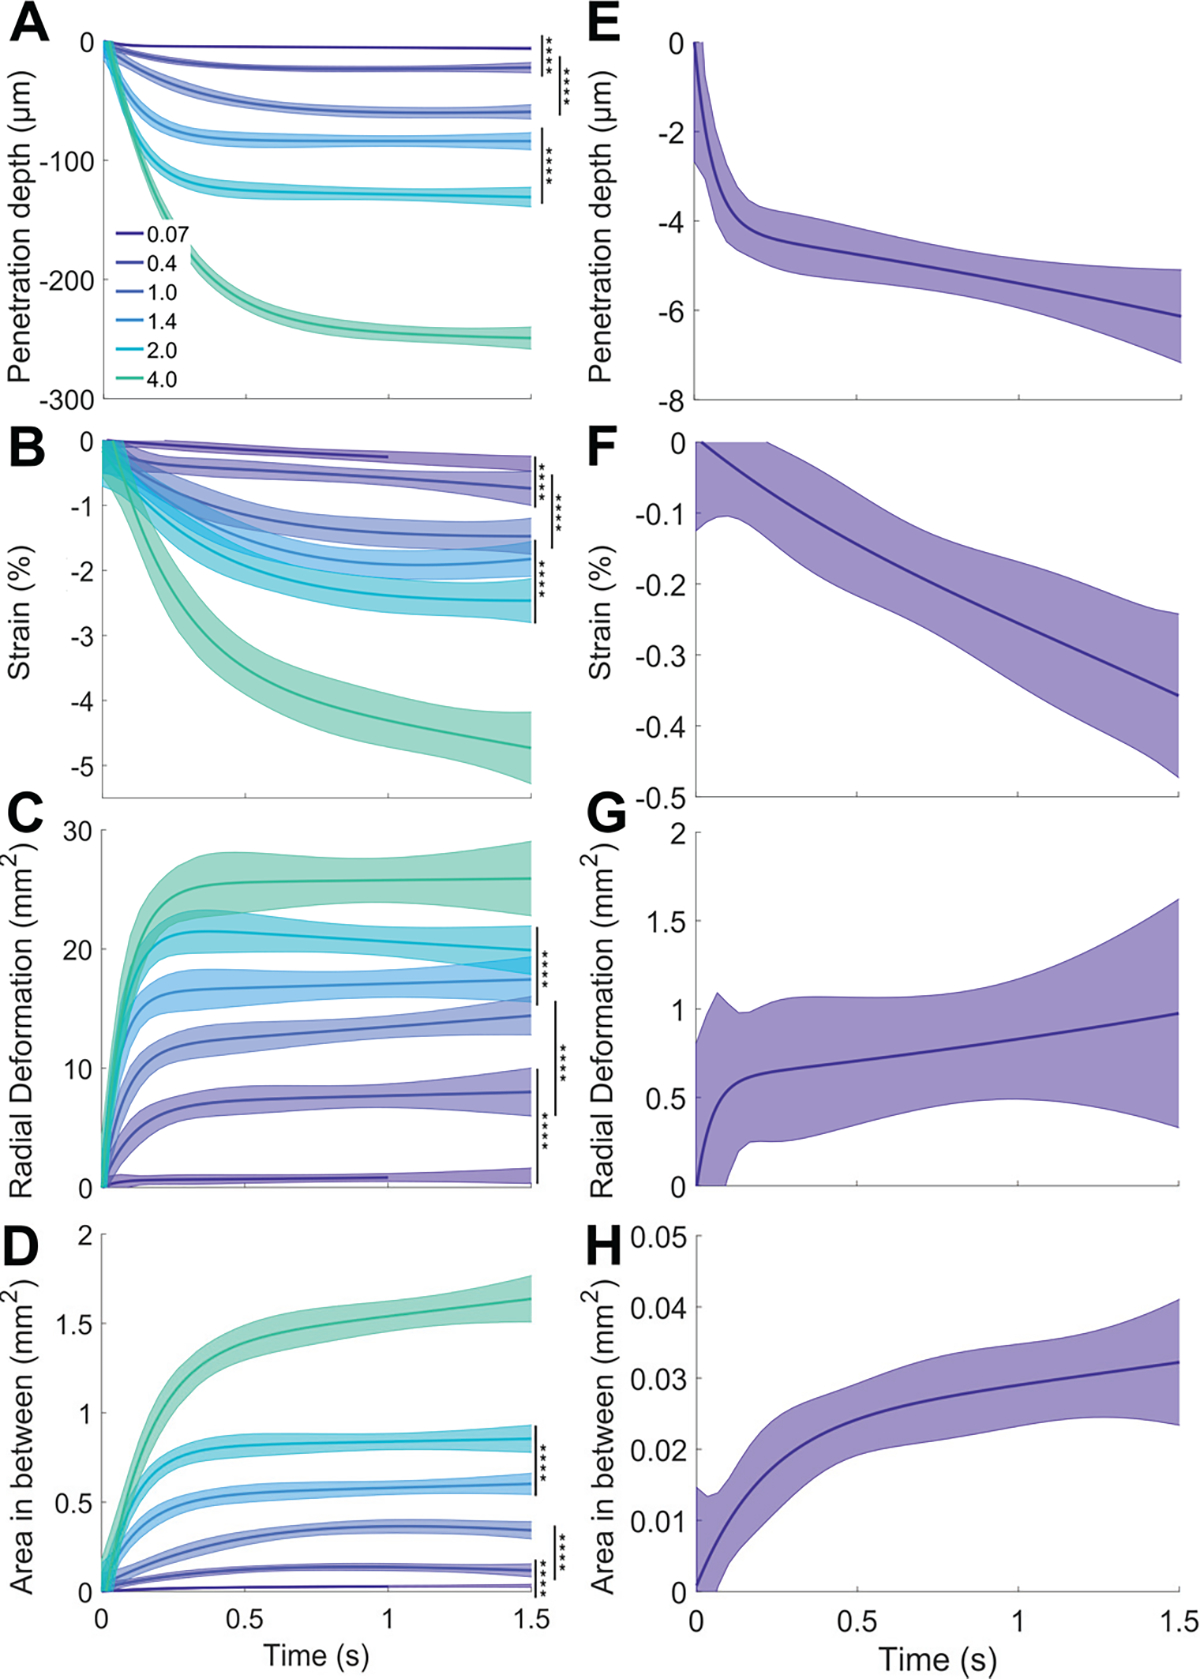
Figure 4.

Skin deformation metrics in response to von Frey monofilaments (force range: 0.07 – 4.0 g). (A)-(D) Experimental data from all participants and trials. Solid curves indicate an exponential fit to the raw data. Shaded regions represent the upper and lower 95% confidence intervals of the fit and ****p < 0.0001, by the two-sample t-test. (E)-(H) Plots showing metrics for only the 0.07 g monofilament with adjusted y-axis scale to illustrate DIC tracking of deformation at the micrometer level.
