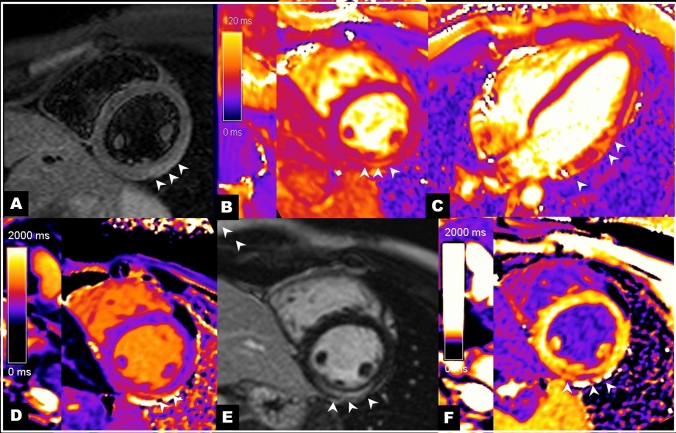
Fig. 1.
CMR in the acute setting: A STIR short axis images of the left ventricle and B and C T2 mapping short axis and 4-chamber view showed edema in the inferior, infero-lateral and antero-lateral ventricular wall (white arrows head). Native T1 mapping (D) showed in the same area increased signal intensity. LGE (E) and T1 post-contrast (F) images showed midwall enhancement (white arrows head)

