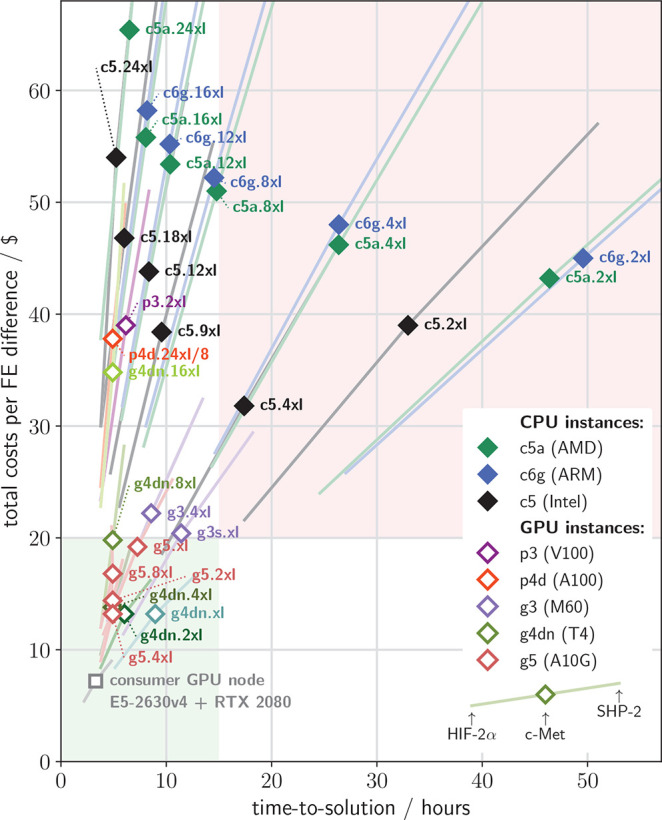
Figure 8.

Costs and time needed to compute one FE difference. Diamonds show the costs to compute one FE difference (using Spot pricing) versus the time-to-solution for various instance types (colors) for the c-Met system. In addition to c-Met, HIF-2α is shown at the lower left end of each colored line, and SHP-2 at the upper right end. The gray square shows costs and timings for a consumer GPU node specifically tuned for GROMACS simulations, as discussed in section 4.2 and shown in Figure 6A.
