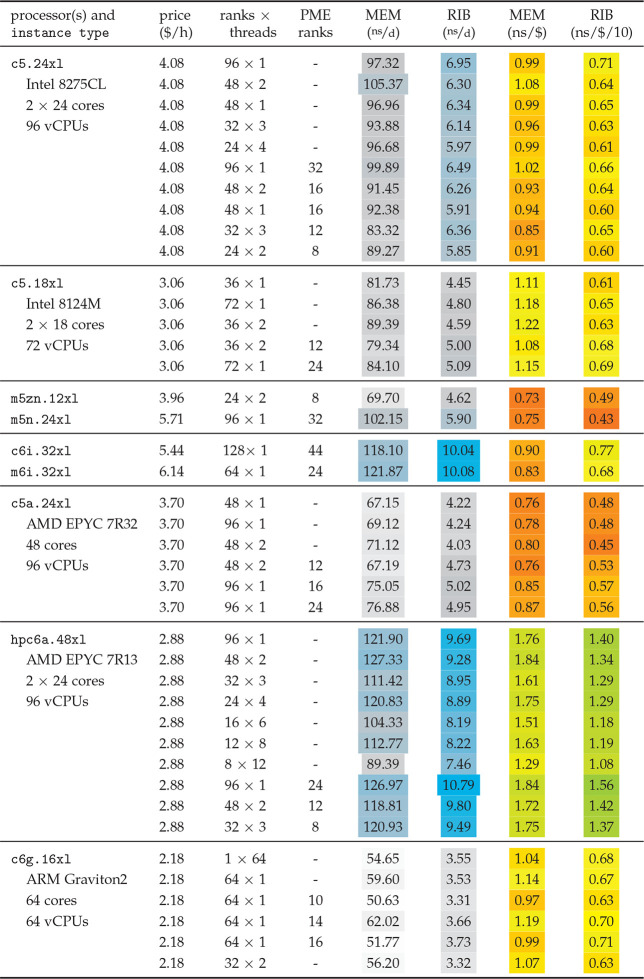
Table 5. GROMACS 2020 Performance on Selected CPU Instancesa.
ns/d values list MEM and RIB performances, and (ns/$) columns show performance to price. Values are color-coded for a quick visual orientation: Grays for low performances, blue towards higher values. For the performance-to-price ratios, reds indicate sub-average ratios, yellows average, and greens above-average ratios.

