Figure 1.
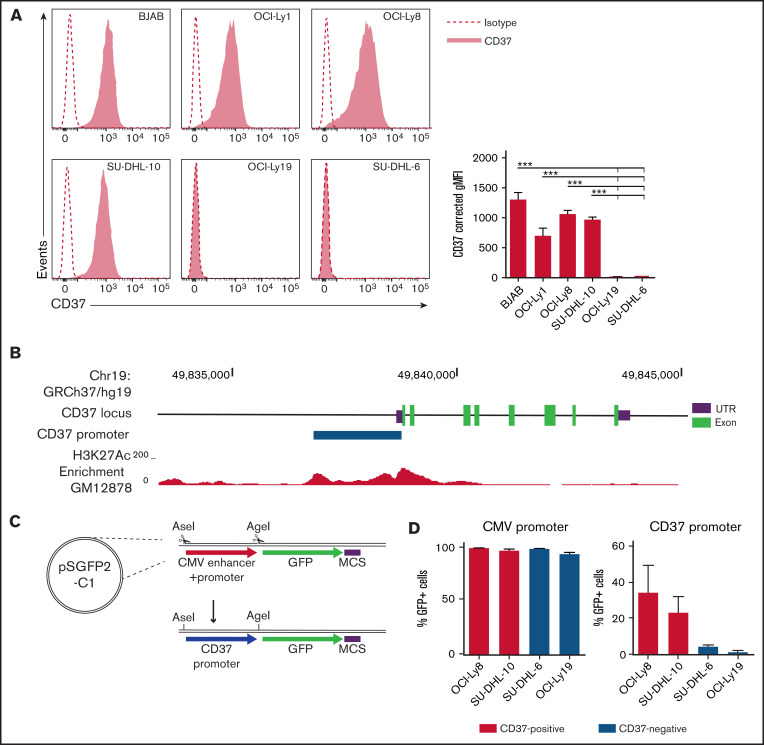
CD37-negative DLBCL cell lines lack CD37 promoter activity. (A) Representative histograms (left) and quantification (right) of flow cytometry analysis of CD37 membrane expression on human DLBCL cell lines. Corrected geometric mean fluorescence intensity (gMFI): gMFI corrected for gMFI of isotype control. One-way ANOVA analysis was followed by Tukey's multiple comparisons test. ***P < .001 represents the significance of each cell line compared with OCI-Ly19 and SU-DHL-6 separately. Data represent mean + SEM of 3 independent experiments. (B) Schematic representation of the CD37 gene locus and upstream sequence. The blue bar indicates the locus of the CD37 promoter as used in (C) and (D), based on the H3K27Ac enrichment in the lymphoblastoid GM12878 cell line (as obtained via the University of California, Santa Cruz Genome Browser, data from the Bernstein Laboratory at the Broad Institute32). UTR, untranslated region. (C) Schematic representation of the GFP-reporter plasmid. GFP, green fluorescent protein; MCS, multiple cloning site. (D) Percentage of GFP-positive cells in CD37-positive and CD37-negative DLBCL cell lines transfected with CMV promoter-GFP or CD37 promoter-GFP construct. Data represent mean + SEM of 3 independent experiments.

