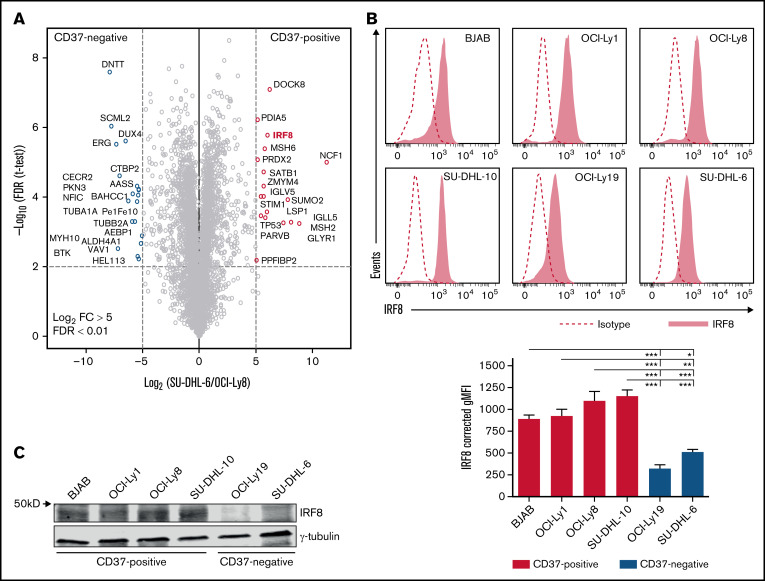
Figure 2.
Identification of IRF8 in CD37-positive DLBCL cell lines. (A) Volcano plot of the label-free quantification (LFQ) of protein abundance in the nuclear protein fractions of CD37-negative (SU-DHL-6) vs CD37-positive (OCI-Ly8) DLBCL cells. Gene names are indicated. The volcano plot presents data of n = 3 technical replicates for both SU-DHL-6 and OCI-Ly8 extract. (B) Representative histograms (top) and quantification (bottom) of flow cytometry analysis of IRF8 expression in human DLBCL cell lines. Corrected gMFI: gMFI corrected for gMFI of isotype control. One-way ANOVA analysis was followed by Tukey's multiple comparisons test. ***P < .001, **P < .01, *P < .05. Data represent mean + SEM of 3 independent experiments. (C) Representative western blot stained for IRF8 and γ-tubulin as loading control in indicated CD37-positive and CD37-negative DLBCL cell lines.

