Figure 3.
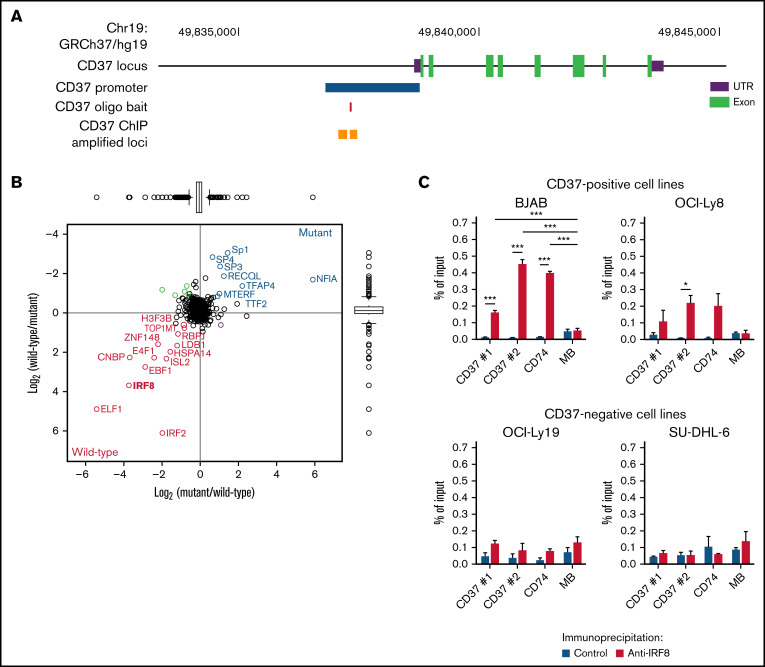
IRF8 binds to the upstream regulatory region of the human CD37 gene. (A) Schematic representation of the CD37 gene locus and upstream sequence. The blue bar indicates the locus of the CD37 promoter, as shown in Figure 1. The red bar indicates the sequence locus of the DNA oligo bait. Orange boxes show amplified loci in qPCR preceded by immunoprecipitation using an anti-IRF8 antibody (ChIP-seq). (B) Scatterplot showing the results of a DNA pulldown experiment with CD37 oligo bait, analyzed by liquid chromatography-mass spectrometry using dimethyl labeling for quantification. The x-axis shows the ratio of proteins labeled as mutant bait: heavy/WT CD37 bait: light, whereas the y-axis shows the label-swap experiment (WT CD37 bait: heavy/mutant bait: light). Proteins labeled in blue are specific interactors of the mutated control sequence, and proteins labeled in red are specific interactors of the WT sequence. (C) ChIP using anti-IRF8 antibody or control, followed by qPCR analysis in 2 CD37-positive (BJAB [left], OCI-Ly8 [right]) and 2 CD37-negative (OCI-Ly19 [left], SU-DHL-6 [right]) DLBCL cell lines. Two primer sets were used to analyze the CD37 upstream locus, as indicated in (A). CD74 was used as a positive control and MB as a negative control. Differences were determined using a 2-way ANOVA followed by Tukey's multiple comparisons test. *P < .05, ***P < .001. Data represent mean + SEM of 3 independent experiments.

