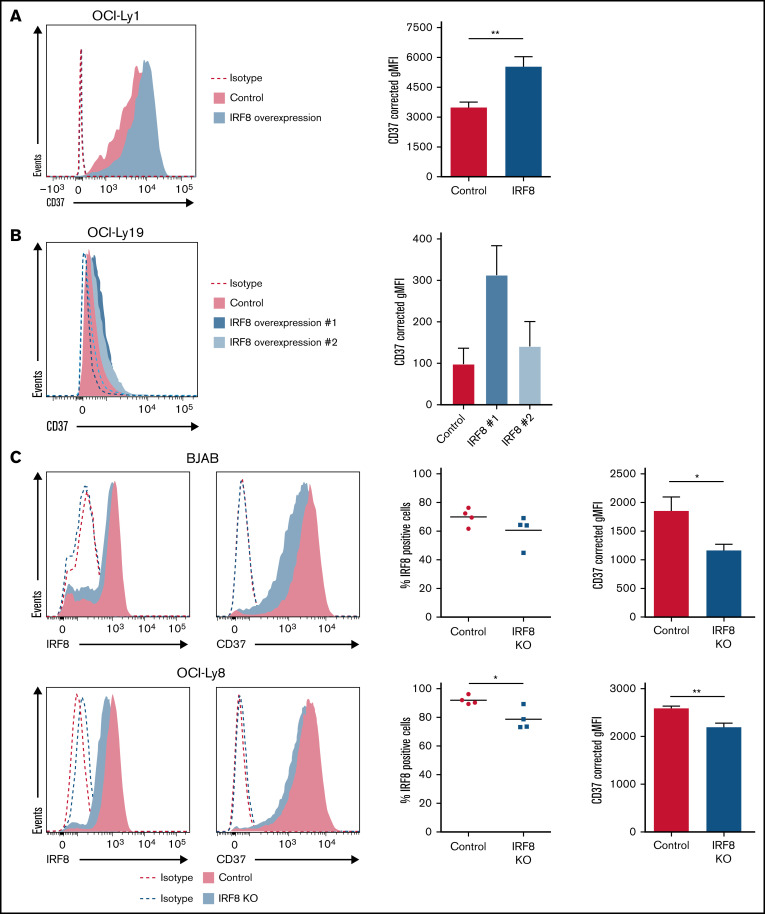
Figure 4.
IRF8 directly affects the expression of CD37 in DLBCL cell lines. (A) Representative histogram (left) and quantification (right) of flow cytometry analysis of CD37 membrane expression on GFP-positive OCI-Ly1 cells transfected with empty IRES-EGFP (control) or IRF8-IRES-EGFP expression plasmid (IRF8). **P < .01, paired t test. Data represent mean + SEM of 4 independent experiments. (B) Representative histogram (left) and quantification (right) of flow cytometry analysis of CD37 membrane expression on 2 independent batches of OCI-Ly19 cells that stably overexpress IRF8. Data represent mean + SEM of 3 independent experiments. (C) Representative histograms (left) and quantification (right) of flow cytometry analysis of BJAB (top) and OCI-Ly8 (bottom) control and IRF8 KO cells. The percentage of IRF8-positive cells was determined as the percentage of cells with IRF8 signal above isotype level: *P < .05, unpaired t test. Quantification of CD37 expression: *P < .05, **P < .01, unpaired t test. Data represent mean + SEM of 4 independent experiments. Corrected gMFI: gMFI corrected for gMFI of isotype control.

