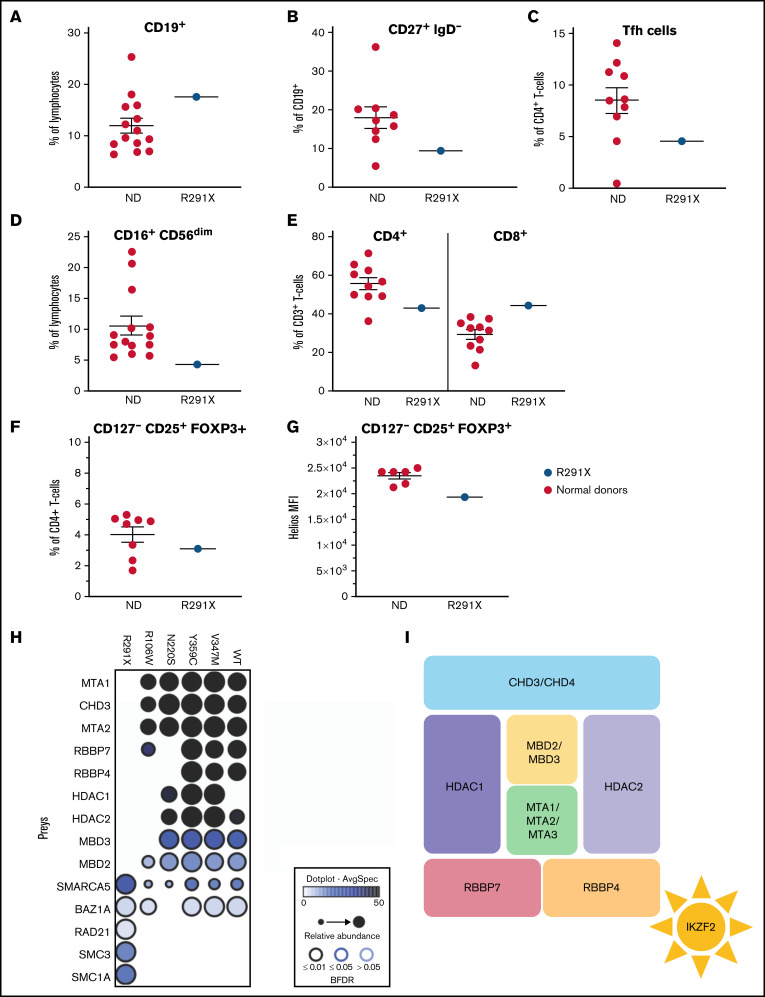
Figure 2.
Aberrant immune phenotype of the index patient and interactome in the patient cohort. (A-F) Graphs showing the frequency of B cells (CD3−CD19+) within lymphocytes (A) and class-switched (CD27+IgD−) B cells within CD3−CD19+ cells (B). (C) Tfh cells (CXCR5+CD45RA−) within CD3+CD4+ cells. (D) NK cells (CD16+CD56dim) within lymphocytes. (E) CD4+ and CD8+ cells within total (CD3+) T cells. (F) Proportion of Treg cells (CD127−CD25+FOXP3+) within CD3+CD4+ cells in patients and controls. (G) HELIOS mean fluorescence intensity (MFI) within CD127−CD25+FOXP3+ Treg cells. The Helios antibody used recognizes all Helios variants. (H) Dot plot representation of high-confidence Biotin Identification interactors that are known components of the nucleosome remodeling histone deacetylase (NuRD) complex of wild-type (WT) and mutant HELIOS. Dot size indicates relative abundance, dot fill color indicates average spectral count, and dot border color indicates statistical significance. (I) Schematic description of the NuRD complex. BFDR, Bayesian false discovery rate; ND, normal donor.

