Figure 1.
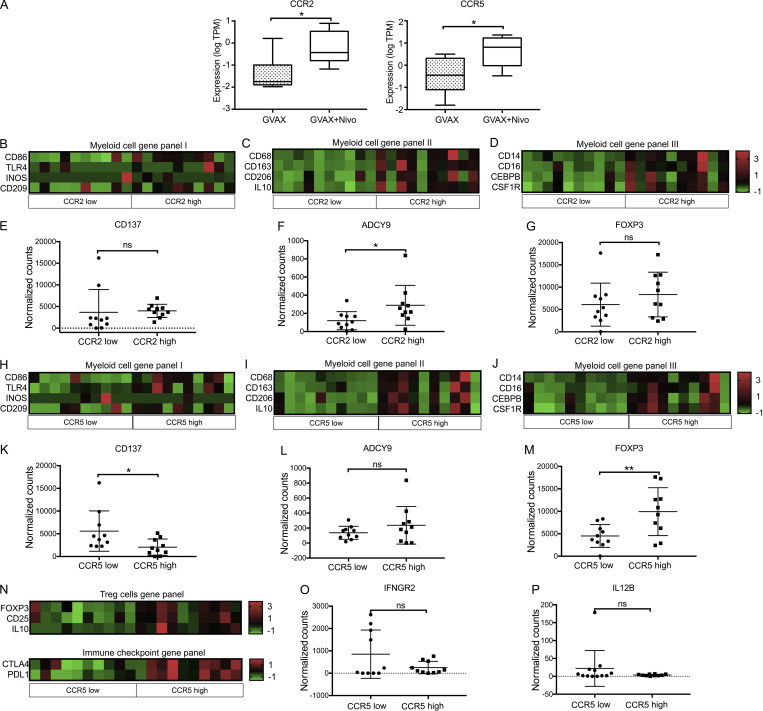
RNAseq of isolated immune cells from human PDAC tissue. Flow cytometry was used to sort CD4+, CD11b+, and CD8+ cells from immune cells isolated from PDAC resected from patients treated with GVAX or GVAX + nivolumab (nivo; n = 20). RNA was purified from sorted cell types, and RNAseq was performed. Normalized read count is shown. (A) Expression of CCR2 and CCR5 in sorted CD11b+ cells from PDACs belonging to the GVAX and GVAX + nivolumab treatment arms. The median expression level of CCR2 or CCR5 was used as the cutoff to divide the tumors into CCR2-low and CCR2-high subgroups or CCR5-low and CCR5-high subgroups. (B–G) For comparison between tumors with CCR2-low expression in CD11b+ cells vs. those with CCR2-high expression in CD11b+ cells, shown are heatmaps of gene expressions in CD11b+ cells of myeloid cell gene panel I, including the genes whose expression has been described in M1-like macrophages (B), myeloid cell gene panel II, including the genes whose expression has been described in M2-like macrophages (C), and myeloid cell gene panel III, including the genes whose expression has been described in MDSCs (D); shown are expression in CD8+ T cells of CD137 (E) and ADCY9 (F) and in CD4+ T cells of FOXP3 (G). (H–M) For comparison between tumors with CCR5-low expression in CD11b+ cells vs. those with CCR5-high expression in CD11b+ cells, shown are heatmaps of gene expressions in CD11b+ cells of myeloid cell gene panel I, including the genes whose expression has been described in M1-like macrophages (H), myeloid cell gene panel II, including the genes whose expression has been described in M2-like macrophages (I), and myeloid cell gene panel III including the genes whose expression has been described in MDSCs (J); shown are expression in CD8+ T cells of CD137 (K) and ADCY9 (L) and in CD4+ T cells of FOXP3 (M). (N–P) For comparison between tumors with CCR5-low expression in CD4+ T cells vs. those with CCR5-high expression in CD4+ T cells, shown are heatmaps of gene expressions in CD4+ T cells of Treg cell gene panel including the genes whose expression has been described in Tregs and immune checkpoint gene panel including CTLA-4 and PD-L1; shown are gene expression in CD8+ T cells of IFNGR2 (O) and IL12B (P). *, P < 0.05; **, P < 0.01, by unpaired t test.

