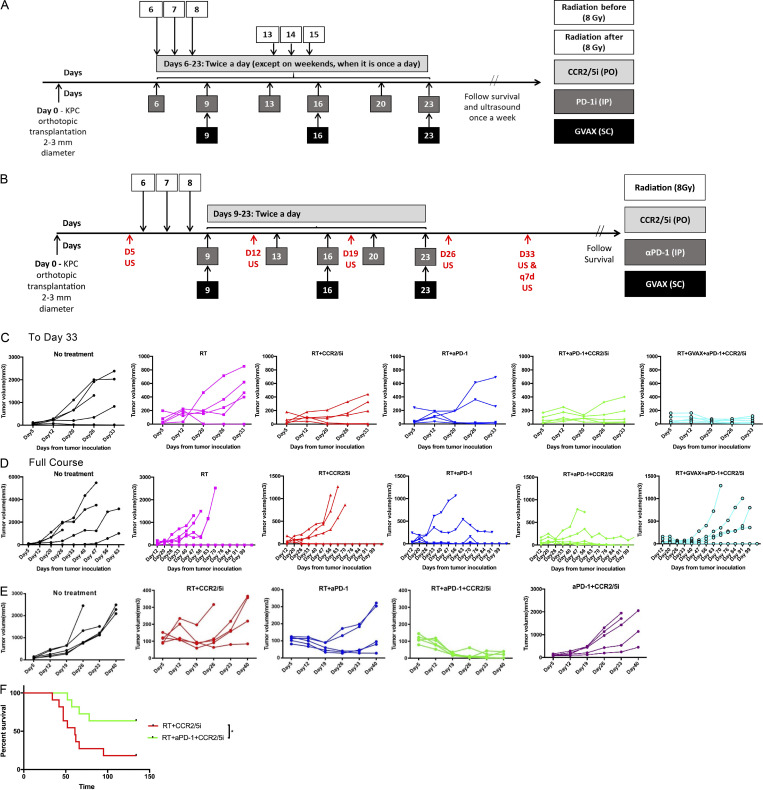
Figure S3.
The treatment schema and tumor growth curve in different treatment groups. (A) Schema of orthotopic tumor implantation in mice, followed by treatment with GVAX, αPD-1 (5 mg/kg), CCR2/5i (50 mg/kg), and RT (3 fractions of 8 Gy). Two different schedules of RT were used (n = 5 per group). Ultrasound was used to monitor tumor size. Results are shown in Fig. 2, A and B. (B) Schema of orthotopic tumor implantation in mice, followed by treatment with GVAX, αPD-1 (5 mg/kg), CCR2/5i (50 mg/kg), and RT (3 fractions of 8 Gy). RT was administered prior to initiation of immunotherapy. Ultrasound was used to monitor tumor size. Results are shown in Fig. 2 C and below (C and D). (C) Tumor growth curves of different treatment groups as measured by ultrasound until day 33 from tumor implantation. (D) Tumor growth curves of different treatment groups as measured by ultrasound until death of mice or completion of experiment. (E) Experimental schema shown in Fig. 3 A. CCR2/5i was dosed twice daily continuously until death of mice or completion of experiment; tumor growth curves of different treatment groups were measured by ultrasound until day 33 from tumor implantation (n = 5 per group). (F) Kaplan–Meier survival curves of mice treated with different combinations. Data for all figures represent results obtained from experiments with 11 mice per treatment group. This analysis combines the results from two repeated experiment arms described in Fig. 3 A. *, P < 0.05, by log-rank test.

