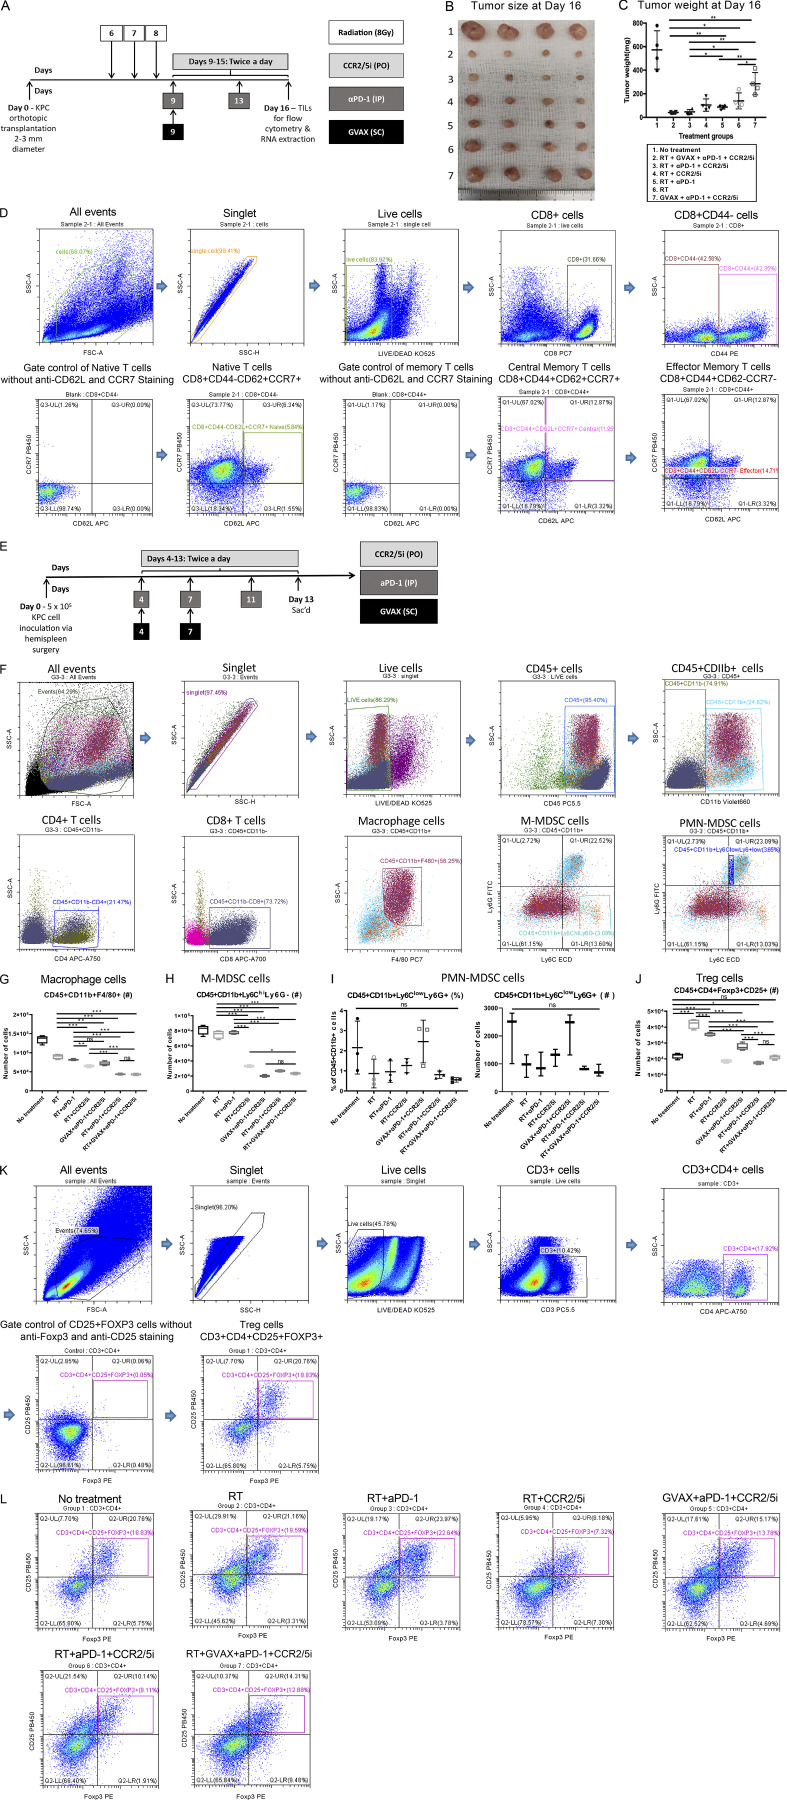
Figure S4.
CCR2/5 dual-antagonist in combination with RT and anti–PD-1 therapy enhanced the effector memory T cell infiltration and reversed the suppressive immune cell environment. (A) Treatment schema of mice (n = 4 per group). Mice underwent orthotopic implantation and were treated with different combinations of GVAX, CCR2/5i (50 mg/kg), αPD-1 (5 mg/kg), and RT (3 fractions of 8 Gy on days 6–8). (B and C) Tumors were harvested at day 16 from tumor implantation (B) and the tumors were weighed (C). (D) Flow cytometry gating strategy for identification of naive/central memory/effector memory T cells. First, side scatter height (SSC-H) and side scatter area (SSC-A) plots were used to exclude doublets. Dead cells were excluded by gating on cells negative for the viability marker Aqua Blue. The expression of CD44 was used to identify naive (CD8+CD44−) and memory (CD8+CD44+) T cells. The naive T cells were defined as CD8+CD44−CD62+CCR7+. The expression of CD62L and CCR7 was used to define central memory T cells (CD8+CD44+CD62+CCR7+) and effector memory T cells (CD8+CD44+CD62−CCR7−). (E) Treatment schema of mice (n = 4 per group). Syngeneic mice underwent hemispleen surgery were treated with different combinations of GVAX, CCR2/5i (50 mg/kg), and αPD-1 (5 mg/kg). The mice were sacrificed on day 13 from hemispleen surgery, and the livers were harvested for IFN-γ ELISA. (F) Mice underwent orthotopic surgery and were treated with different combinations of GVAX, CCR2/5i (50 mg/kg), and αPD-1 (5 mg/kg). Mice were sacrificed on day 16 from orthotopic tumor implantation, and flow cytometry analysis was performed on the isolated tumor-infiltrating immune cells. The flow cytometry gating strategy of different cell types is shown. (G) Number of macrophages (CD45+CD11b+F4/80+) on flow cytometry analysis of immune cells isolated from orthotopically implanted KPC tumor resected from mice following treatment. The number of isolated tumor-infiltrating immune cells was normalized to the tumor weight. (H) Number of M-MDSCs (CD45+CD11b+Ly6ChiLy6G−) on flow cytometry analysis of immune cells isolated from orthotopically implanted KPC tumor resected from mice following treatments as indicated. (I) Percentage within the total myeloid CD45+CD11b+ population and number of PMN-MDSCs (CD45+CD11b+Ly6ClowLy6G+) on flow cytometry analysis. (J) Number of Treg cells (CD45+CD11b−CD25+Foxp3+) on flow cytometry analysis of immune cells isolated from orthotopically implanted KPC tumor resected from mice following treatments as indicated. Data represent mean ± SEM from one representative experiment of four to five mice per treatment group, and the isolated immune cells from mice from the same treatment group were pooled and measured in triplicate. These experiments were repeated twice. *, P < 0.05; **, P < 0.01; ***, P < 0.001, by one-way ANOVA. (K) The flow cytometry gating strategy for Treg cells is shown. Lymphocytes were identified based on their forward- and side-scatter properties. Subsequently, singlet cells were gated; and dead cells were excluded by gating on cells negative for the viability marker Aqua Blue. CD3 and CD4 were used to identify T helper cells (CD3+CD4+) among the selected viable lymphocytes. Conventional Tregs were defined as CD4+ T cells coexpressing CD25 and FOXP3. (L) Shown are representative flow cytometry graphs of Treg cells (CD3+CD4+CD25+Foxp3+) in each treatment group as indicated.

