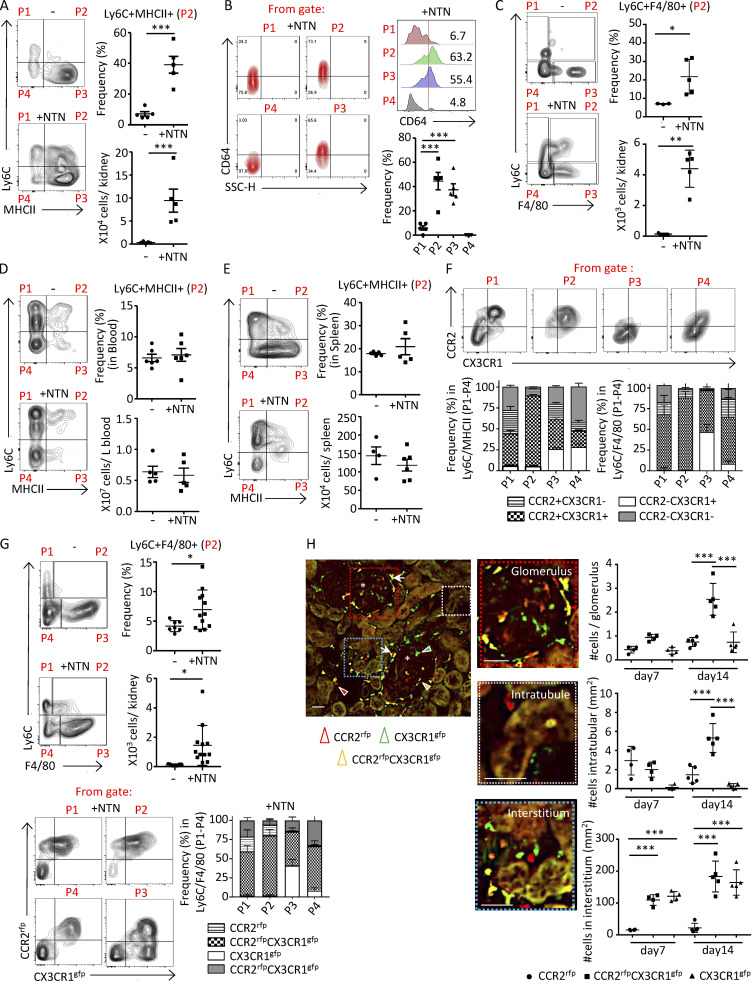
Figure 1.
Renal accumulated monocytes in nephritic mice express macrophage markers and are DP for CCR2 and CX3CR1. Mice were either untreated (−) or subjected to NTN (+NTN) and analyzed on day 14. CD11b+ lineage-negative cells were evaluated for Ly6C and MHCII or Ly6C and F4/80 as indicated. The defined P1–P4 populations were further analyzed for CD64 or CCR2 and CX3CR1. (A) Representative FACS plots of four subsets of monocytes in the kidney of Wt mice defined by Ly6C and MHCII distinguishes four populations (P1–P4; left). The frequency and absolute counts of the Ly6C+MHCII+ (P2) population (right) are shown. (B) Populations P1–P4 defined in A were further analyzed for CD64. Representative FACS profiles (left), histogram representation (right upper) and frequency graph (right lower) of CD64 in P1–P4 populations are shown. SSC, side scatter. (C) Representative FACS plots of Ly6C and F4/80 in Ccr2rfp+/−Cx3cr1gfp+/− reporter mice. The frequencies and absolute counts of the Ly6C+F4/80+ (P2) population are shown. (D and E) Representative FACS profiles, frequencies, and absolute counts of Ly6C+MHCII+ (P2) cells in blood (D) and spleen (E). (F) Representative FACS plots for P1–P4 populations defined for Ly6C and MHCII in nephritic mice in A and further analyzed for CCR2 and CX3CR1. The frequency of renal subpopulations defined by CCR2 and CX3CR1 in Ly6C and MHCII parent P1–P4 populations (A, +NTN) and Ly6C and F4/80 parent P1–P4 populations (C, +NTN), are shown in grouped bar graphs. (G) Analysis of radiation chimeras of Wt recipients reconstituted with bone marrow from Ccr2rfp+/−Cx3cr1gfp+/− reporter mice with or without NTN induction. Representative profiles of Ly6C monocytes evaluated for F4/80 expression (left) and the frequencies and absolute counts of the P2 (Ly6C+F4/80+) populations (right) are given. In bottom panels, frequency of populations P1–P4 further analyzed for CCR2 and CX3CR1 (as shown in the representative FACs plot) are shown in a grouped bar graph. (H) Histological analysis of three monocyte populations in kidney sections of radiation chimeric Wt recipients reconstituted with Ccr2rfp+/−Cx3cr1gfp+/− bone marrow identified by CCR2rfp and CX3CR1gfp in the glomerulus, intratubular and renal interstitial compartment on days 7 and 14 after NTN induction. Representative image of monocytes in glomeruli (asterisks) and juxtaglomerular regions (white arrows) are shown. Scale bar = 50 μm. Cells expressing CCR2 (red), CX3CR1 (green), or both fluorophores (yellow) are indicated by arrowheads. Enlarged areas of the glomerulus, interstitium, and intratubular space are shown. The number of cells in each of these compartments was determined. Two independent experiments were performed for A–H. Data are mean ± SEM. For A–E, G, and H, unpaired two-tailed t test (two data sets comparison) and one-way ANOVA (Tukey’s multiple comparison test) were performed. *, P < 0.05; **, P < 0.01; ***, P < 0.005 vs. normal basal values.

