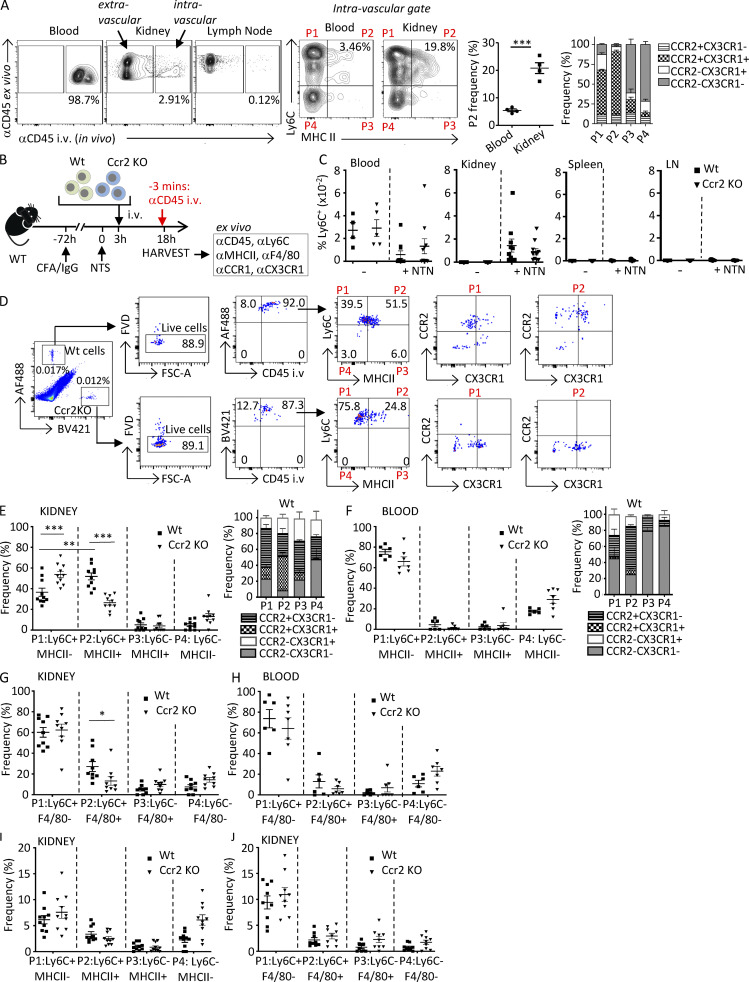
Figure 5.
Monocytes acquire MHCII and F4/80 within the vasculature following NTN in a CCR2-dependent process. (A) On day 14 after induction of NTN in Wt mice, anti-CD45 was injected i.v. via the tail vein 3 min before harvesting blood, kidney, and lymph nodes to label intravascular cells. Single-cell suspensions of samples were further labeled ex vivo with antibodies to CD45 and monocyte and macrophage markers. Representative images of intravascular (i.e., αCD45 in vivo and ex vivo positive) and extravascular (i.e., αCD45 in vivo negative and ex vivo positive) cells are shown. In vivo–labeled CD45+, lineage-negative (CD3−CD11c−NK1.1−Ly6G−) cells further analyzed for Ly6C and MHCII defined four populations (P1–P4). The frequency of Ly6C+MHCII+ (P2) is shown in a scatter plot, and CX3CR1 and CCR2 frequency in P1–P4 populations is shown in a grouped bar graph. n = 4 mice. Significance was determined by two-tailed unpaired t test. (B) Schematic of timeline of adoptive transfer and induction of NTN for C–J. Ly6C+ monocytes purified from bone marrow of Wt and Ccr2 KO mice were labeled with CellTrace CFSE dye (AF488-green) and CellTrace violet dye (BV421-blue), respectively, and adoptively transferred into Wt mice, which were preimmunized with CFA plus rabbit IgG at −72 h and NTS at 0 h to induce NTN. Blood, kidney, spleen, and lymph nodes (LN) were harvested after 18 h. 3 min before harvest, mice were i.v. injected with anti-CD45. Harvested samples were stained ex vivo with indicated antibodies. (C) The frequencies of labeled Wt and Ccr2 KO monocytes in indicated organs of recipient Wt mice that were untreated (−) or subjected to NTN (+NTN) are shown. (D) Gating strategy for Wt and Ccr2 KO monocytes detected by CellTrace tracker dyes in whole-kidney homogenates from Wt recipients subjected to NTN. Cells assessed for in vivo CD45 labeling and then Ly6C and MHCII distinguished four populations (P1–P4) that were further analyzed for CCR2 and CX3CR1, for which representative profiles are only shown for P1 and P2, as they were the predominant populations. FSC, forward scatter. (E and F) Frequency of Ly6C+MHCII− (P1), Ly6C+MHCII+ (P2), Ly6C−MHCII+ (P3), and Ly6C−MHCII− (P4) for kidney (E) and blood (F) are shown. Frequency of CX3CR1 and CCR2 in P1–P4 populations are shown in grouped bar graphs. (G and H) Kidney (G) and blood (H) cells were also stained for Ly6C and F4/80 and analyzed as in E and F. (I and J) Frequency of Ly6C and MHCII (I) or F4/80 (J) extravascular populations, which are negative for the in vivo and positive for the ex vivo CD45 antibody, are shown. Two to three independent experiments were performed for all experiments. Data are expressed as mean ± SEM. Statistical significance was determined by one-way ANOVA with Dunnett’s t test correction. *, P < 0.05; **, P < 0.01; ***, P < 0.005.

