Figure 7.
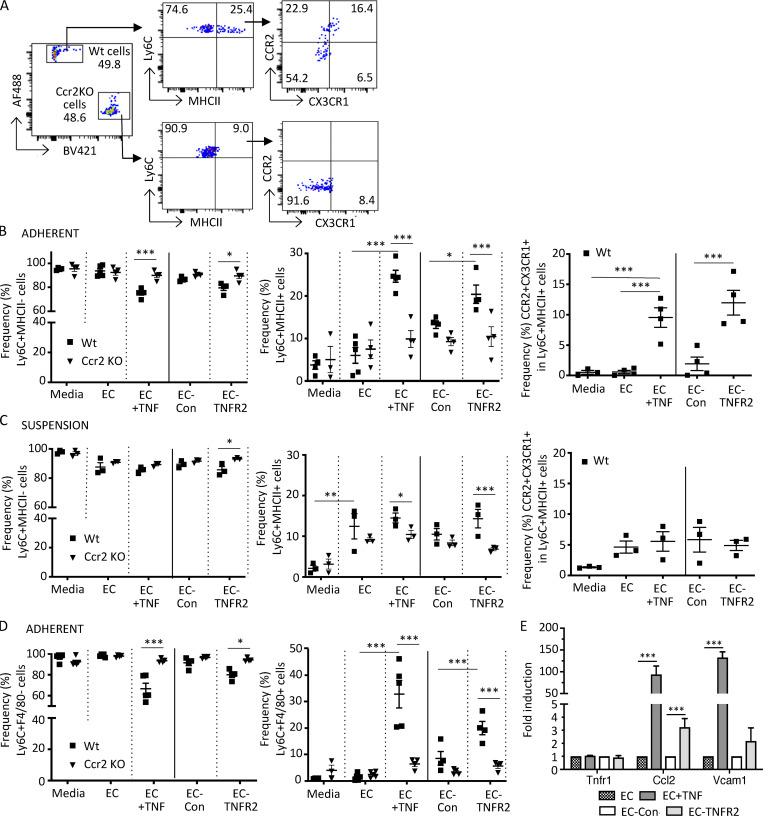
Monocytes adherent to TNF-activated or TNFR2-transduced endothelial cells acquire macrophage markers. CellTrace CFSE dye (AF488)–labeled Wt and CellTrace violet dye (BV421)–labeled Ccr2 KO monocytes harvested from mice were incubated for 18 h in medium alone (media); with endothelial cells that were untreated (EC), stimulated with rat TNFα for 6 h and washed (EC + TNF), or transduced with control lentivirus (EC-Con); or with TNFR2 lentivirus (EC-TNFR2). Endothelial adherent and nonadherent (suspension) monocytes were harvested separately and processed for FACS analysis. (A) Flow cytometry gating strategy for detection of differentially labeled Wt and Ccr2 KO monocytes adherent to TNF-activated endothelial cells. Cells were gated for viability and stained for Ly6C and MHCII and the Ly6C+MHCII+ population was further analyzed for CCR2 and CX3CR1. (B and C) Analysis of adherent (B) and nonadherent (C) monocytes. Frequency of Ly6C+MHCII− (left) and Ly6C+MHCII+ (middle), and CCR2 and CX3CR1 in the Ly6C+MHCII+ populations (right, only for CellTrace CFSE dye [AF488]–labeled Wt cells), are shown. (D) Adherent cells were analyzed for Ly6C and F4/80 and the frequency of Ly6C+F4/80− (left) and Ly6C+F4/80+ (right) in Wt and Ccr2 KO cells were determined as in B. (E) Analysis of Tnfr1, Ccl2, and Vcam1 message in endothelial cells treated as indicated by quantitative real-time PCR using the indicated gene-specific primers. The normalized fold-change vs. untreated cells (EC) or control virus (EC-Con) was calculated using the ΔΔCt method, with GAPDH as a control gene. Data are mean ± SEM. *, P < 0.05; **, P < 0.01; ***, P < 0.005. Four independent experiments were performed. Statistical significance was determined by multiple t test and one-way ANOVA with Dunnett’s t test correction.

