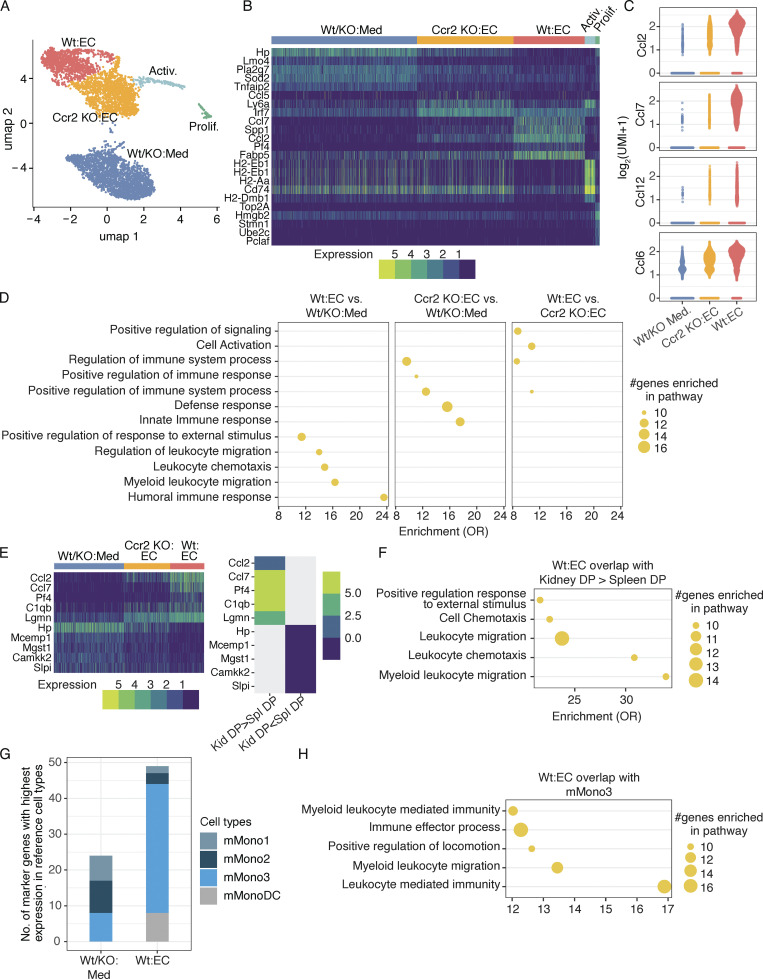
Figure 8.
scRNA-seq characterizes monocytes in contact with activated endothelial cells. (A) UMAP comprising five clusters of Wt and Ccr2 KO monocytes cultured on TNF-activated endothelial cells (EC) and medium alone containing Wt and Ccr2 KO monocytes (Wt/KO:Med) represented in our data set (n = 5,608 cells). (B) Heatmap of the top markers of identified clusters. The number of UMIs as the expression of markers is shown. Top markers are shown here, and all markers are shown in Fig. S4 B. (C) The expression of chemokines Ccl2, Ccl7, Ccl12, and Ccl6 across monocytes cultured on TNF-activated endothelial cells or medium alone. (D) Gene set enrichment in GO terms related to biological processes (GSEA-GO-Bp) for the genes overexpressed in Wt monocytes cultured with activated endothelial cells in comparison to monocytes cultured in medium, Ccr2 KO monocytes cultured with activated endothelial cells in comparison to monocytes cultured in medium alone, and Wt monocytes in comparison to Ccr2 KO monocytes cultured with activated endothelial cells. Top enriched terms are shown here, and all terms are shown in Fig. S4 C. OR, odds ratio. (E) Heatmap of cluster markers (left) which are overexpressed and underexpressed in nephritic kidney DP (Kid-DP) in comparison to spleen DP cells (Spl-DP; right). Top shared markers are shown here, and all shared markers are shown in Fig. S5 A. (F) GSEA-GO-Bp for those markers of Wt monocytes cultured with activated endothelial cells, which were overexpressed in Kid-DP in comparison to Spl-DP. Only top enriched terms are shown here, and all terms are shown in Fig. S5 B. (G) Number of the markers of Wt monocytes cultured on activated endothelial cells and monocytes cultured in medium alone having highest expression in three monocyte populations (mMono1-3) and monocyte-derived dendritic cell population (mMonoDC) from Zilionis et al. (2019). (H) GSEA-GO-Bp for those markers of Wt monocytes cultured with endothelial cells that had higher expression in mMono3 than mMono1, mMono2, and mDC populations in Zilionis et al. (2019). Only top enriched terms are shown here; all terms are shown in Fig. S5 C.

