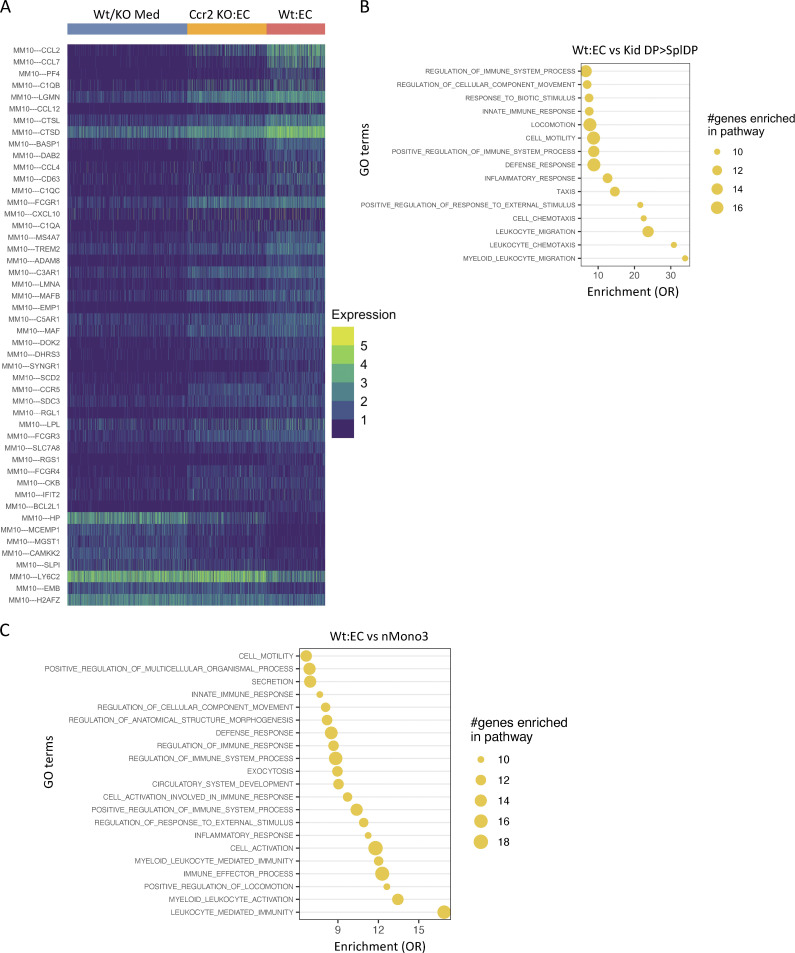
Figure S5.
Overlap and GO term enrichment of genes with CCR2+CX3CR1+ DP monocytes of the nephritic kidney and genes reported in tumor-associated monocytes. (A) Heatmap of cluster markers overexpressed in kidney DP cells (Kid DP) in comparison to spleen DP (Spl DP) cells plotted across clusters of Wt/KO Med, Ccr2 KO:EC, and Wt:EC. (B) GSEA-GO-Bp for those markers of Wt monocytes cultured on endothelium which were overexpressed in kidney in comparison to spleen DPs (Kid DP > Spl DP). OR, odds ratio. (C) GSEA-GO-Bp for those markers of Wt monocytes cultured with activated endothelial cells, which had higher expression in mMono3 than mMono1, mMono2, and mMonoDC populations identified in Zilionis et al. (2019).

