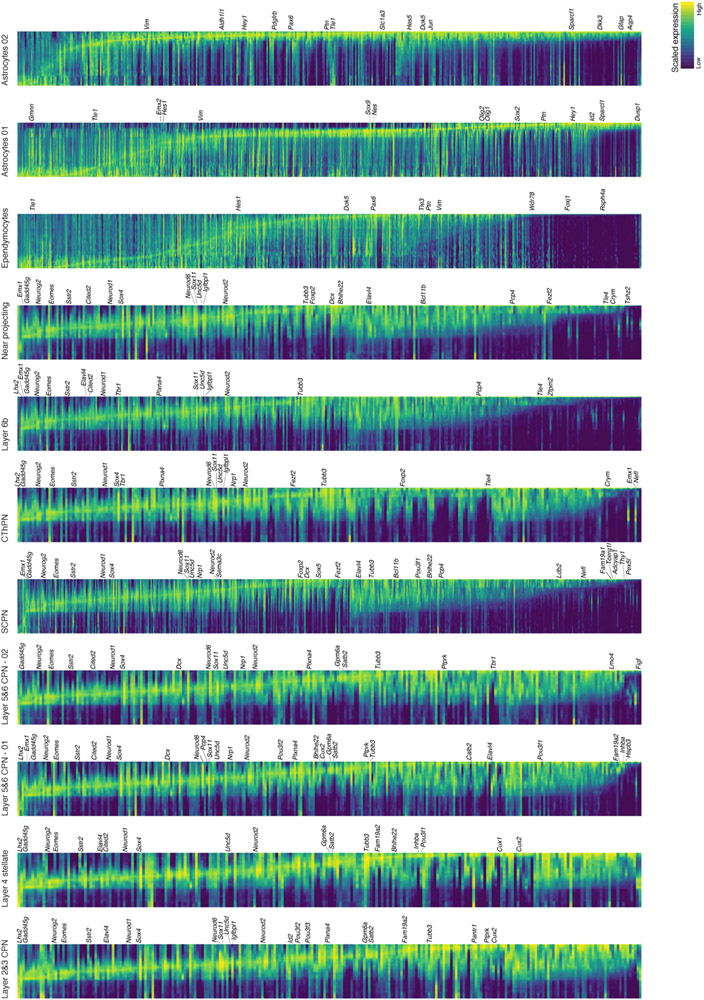
Extended Data Figure 7 (related to Figure 3). Genetic cascades accompanying development of cortical cell types.
Gene cascades for projection neuron subtypes, astrocytes and ependymocytes differentiaton. The x axis represents pseudotime across the tree. Each row is a gene where gene expression is scaled to the maximum observed expression and then smoothened. Genes are ordered by the pseudotime value at which they enter and then leave “peak” expression (expression 50% higher than minimum value), and start and then leave “expression” (expression 20% higher than minimum value), in that order. Smoothening of expression values was performed using spline fitting from URD for expression dynamics (Methods). Known marker genes for the cell type are labelled; see Supplementary Information Table 3 for the full list of genes.

