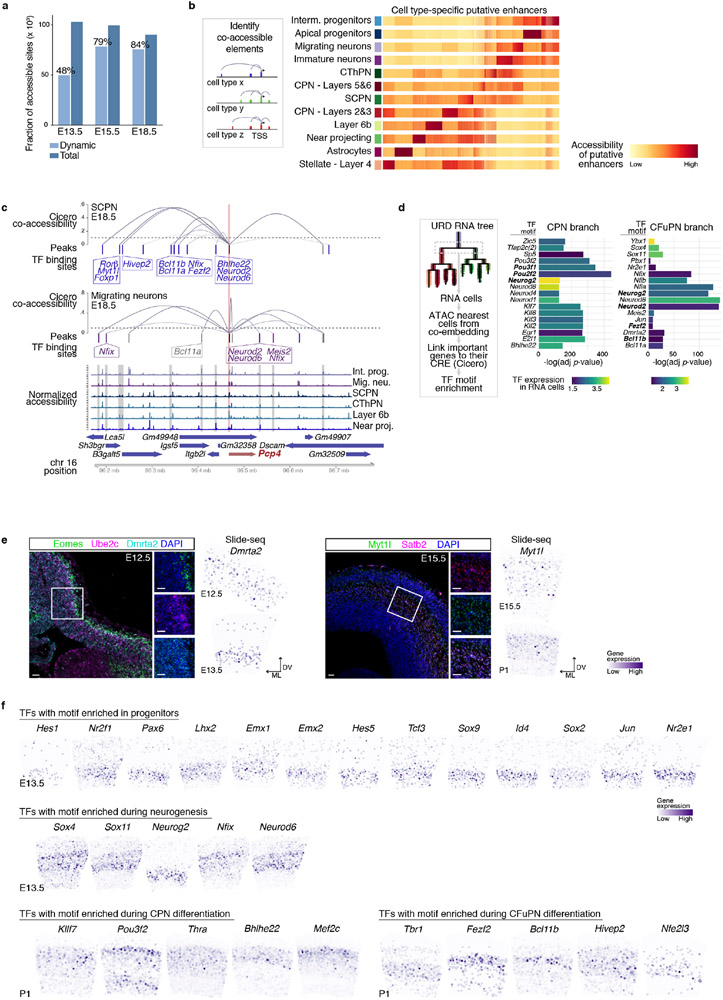
Extended Data Figure 10 (related to Figure 4). Transcription factors with binding sites enriched along cortical development.
a Total number of accessible sites identified per time point and fraction that is dynamic across cell types (i.e., is enriched in at least one cell type). b Left: schematic of the approach used to identify candidate cell type-specific enhancers. Differential expression analysis identified cell type-specific genes, for which we calculated co-accessibility (correlation higher than 25%) between distal elements (within a 250 kb region) and target gene promoters using Cicero, within each cell type. c Distal elements co-accessible with the Pcp4 promoter region in E18.5 SCPN and migrating neurons. Cicero co-accessibility is shown in blue curves, detected peaks in each cell type are shown as colored bars. Black bars correspond to promoter peak, blue bars are peaks selectively co-accessible in CFuPN, and purple bars are peaks only co-accessible in migrating neurons. Boxes indicate transcription factors whose motifs are present in indicated peaks. Peaks are aligned to coverage plots (bottom) showing combined ATAC reads for the indicated cell types. Chromosome coordinates and genes are indicated at bottom. d TF binding sites enrichment on accessible sites of cells in the CPN vs CFuPN branch point (see Fig. 3d) shows significant enrichment of some of the TF detected in Fig. 3d, suggesting an actual role in this step. e Left: In situ hybridization against Eomes (IP marker), Ube2c (mitotic marker) and Dmrta2 showing expression of the latter in the dorsal ventricular zone (VZ) of a E12.5 developing cortex. Right: In situ hybridization against Satb2 and Myt1l showing expression of the latter in newborn neurons, co-expressed with Satb2. Slide-seq gene expression at the indicated ages show similar expression patterns. Scale bars are 30 μm. Representative images from in situ hybridizations repeated in 2 different embryos. ML and DV indicate dorso-ventral and medio-lateral orientations. f Slide-seq gene expression of several transcription factors (TFs) whose binding sites were found to be enriched within the accessible regions of the indicated trajectories (or portion of). Confirmation of gene expression in target cell type supports TF activity.

