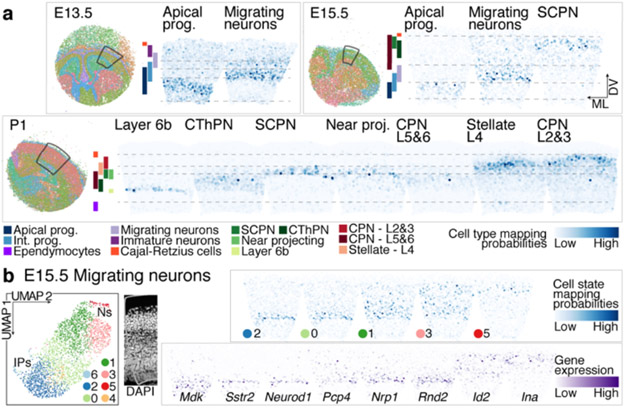
Figure 2. Spatial distribution of cell types in the developing cortex.
a Mapping probability of the main cell types from scRNA-seq onto a matching Slide-seq tissue section using Tangram (right). Left: whole puck with beads colored based on clustering. The area used for the mappings is highlighted. Colored bars represent cell type distribution. Dv, dorso-ventral; ml, medio-lateral.
b Re-clustering of sub-states of E15.5 migrating excitatory neurons. Mapping of sub-states onto E15.5 tissue indicates differential positioning across the radial axis of the cortex. DAPI staining of adjacent section for reference. Expression of genes associated with migrating neuron sub-states in E15.5 Slide-seq.

