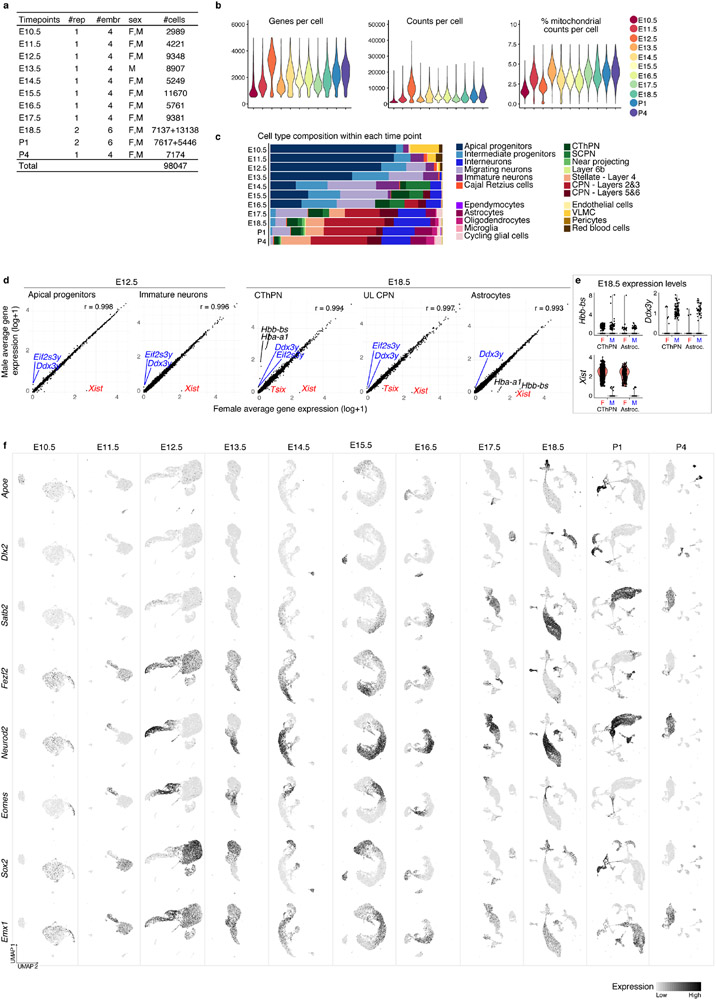
Extended Data Figure 1 (related to Figure 1). Classification of cell types in scRNA-seq data from individual time points.
a Number of replicates, total number of embryos, sex of animals and number of cells analyzed per time point. b Number of genes, number of mRNA molecules (counts), and percentage of mitochondrial counts per cell in each time point. c Proportion of cells corresponding to the different cell types present in each time point. 85 to 98% of cells were successfully identified for each time point. The earliest stages were primarily composed of apical and intermediate progenitors: AP+IP = 77% at E10.5, 80% at E11.5, 69% at E12.5, 66% at E13.5). d Correlation between male (M, Xist expression <1) and female (F, Xist expression >1) cells at E12.5 and E18.5 in selected cell types. Pearson correlation coefficients are indicated. Distinct genes include X-chromosome genes Xist and Tsix and Y-chromosome genes Ddx3y and Eif2s3y. Some hemoglobin genes also appear distinct, but, as shown in e they constitute few outlier cells. e Normalized expression levels of some of distinct genes between male and female cells at E18.5. Only two cell types are shown for clarity. f UMAP visualization of cells collected at each time point, showing expression levels (normalized) of marker genes for dorsal derivatives (Emx1), apical progenitors (Sox2), intermediate progenitors (Eomes), excitatory neurons (Neurod2), inhibitory interneurons (Dlx2), and glial cells (Apoe).

