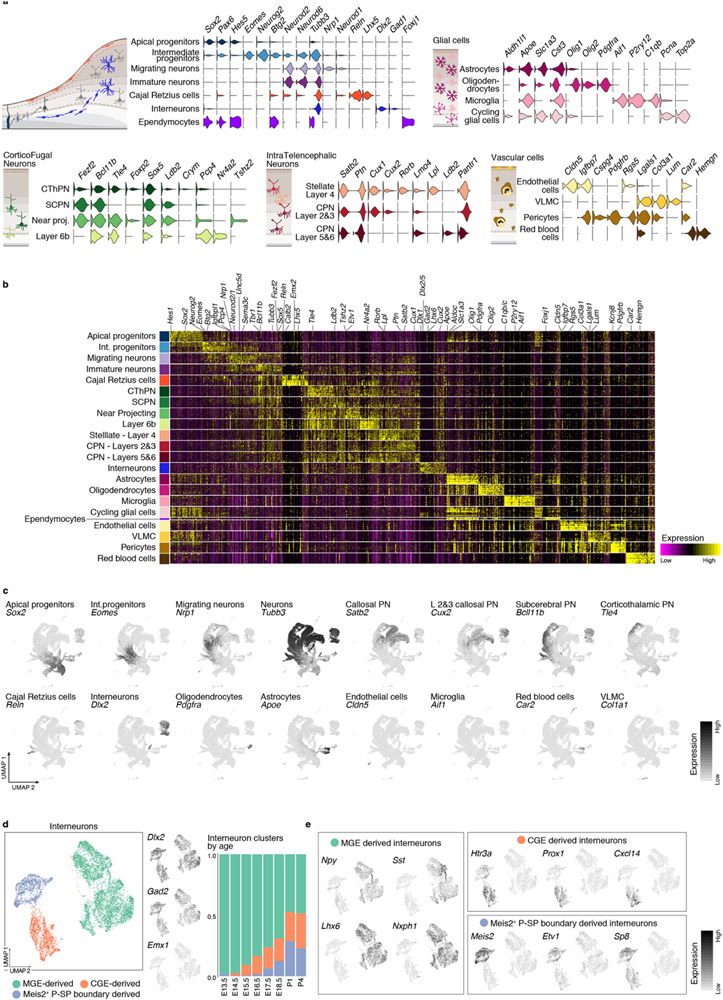
Extended Data Figure 2 (related to Figure 1). Molecular signatures and interneuron heterogeneity in the developing cerebral cortex.
a Selective expression (normalized) of marker genes per cell type in the combined scRNA-seq dataset. Cell types are grouped based on their identity and shared marker genes. b Gene signatures for all cell types identified in the combined time points. Top 20 differentially expressed genes for each cell type are presented. Cells were down-sampled to a maximum of 500 cells per cell type. b Expression of canonical marker genes for selected cell types in the UMAP visualization of the combined scRNA-seq time course. c Different subtypes of interneurons integrate into the developing cortex through time. From left to right: clustering of interneurons collected at all time points, visualized via UMAP. Interneuron UMAP plots show the expression of the inhibitory markers Dlx2 and Gad2, as well as a marker of dorsally-derived cell types (Emx1), not expressed by interneurons. Proportion of cells corresponding to each cluster in each time point. d Expression of genes characteristic of interneurons of different embryonic origins. Medial ganglionic eminence (MGE)-derived interneurons express Npy, Sst, Lhx6 and Nxph1. Interneurons originating in the CGE (caudal ganglionic eminence) are positive for Htr3a, Prox1, Cxcl14 and Sp8. A second population of Htr3a+ interneurons express Meis2, Etv1 and Sp8, putatively from the pallial-subpallial (P-SP) boundary.

