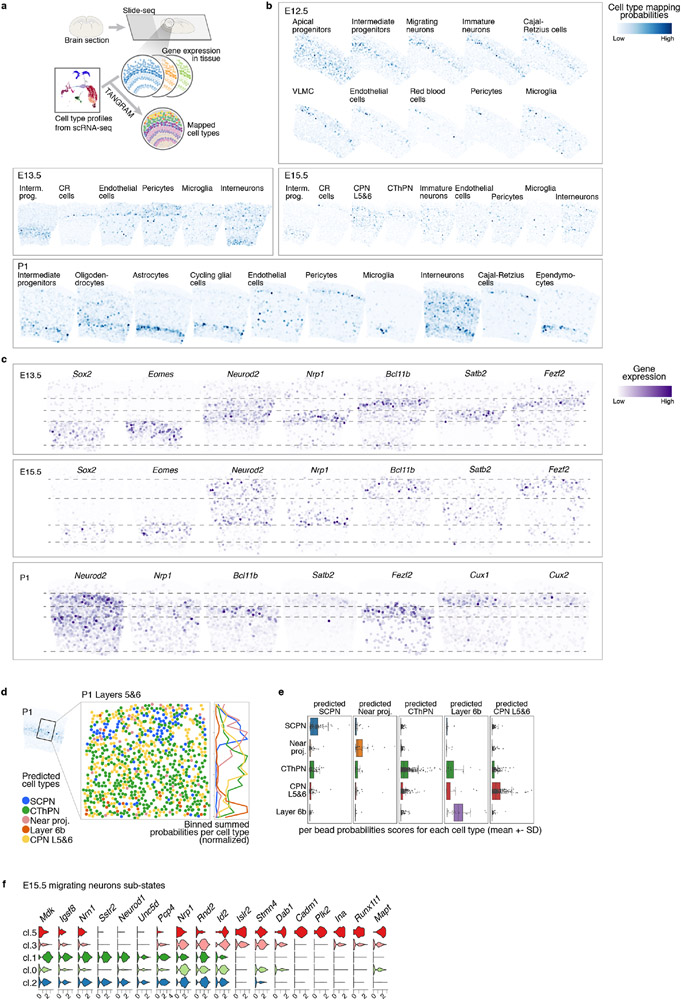
Extended Data Figure 3 (related to Figure 2). Spatial mappings of cell types in the developing cerebral cortex.
a Mapping of extended cell types from the scRNA-seq data onto the matching Slide-seq section. Beads are colored according to the probability of the cell type being mapped in that position. b Gene expression of characteristic genes validating cell types matched for each time point. c Mapping probabilities for the deep layer cell types grouped by the cell type assigned (cell type with highest probability) corresponding to b. In box plots the middle line is the median, the lower and upper hinges correspond to the 25% and 75% quantiles, the upper whisker corresponds to the largest value no larger than 1.5×IQR from the hinge (where IQR is the inter-quartile range) and the lower whisker corresponds to the smallest value at most 1.5×IQR of the lower hinge. Total number of beads= 812. d Gene expression in E15.5 scRNA-seq data of genes associated with the migrating neuron sub-states identified in Figure 2d.

