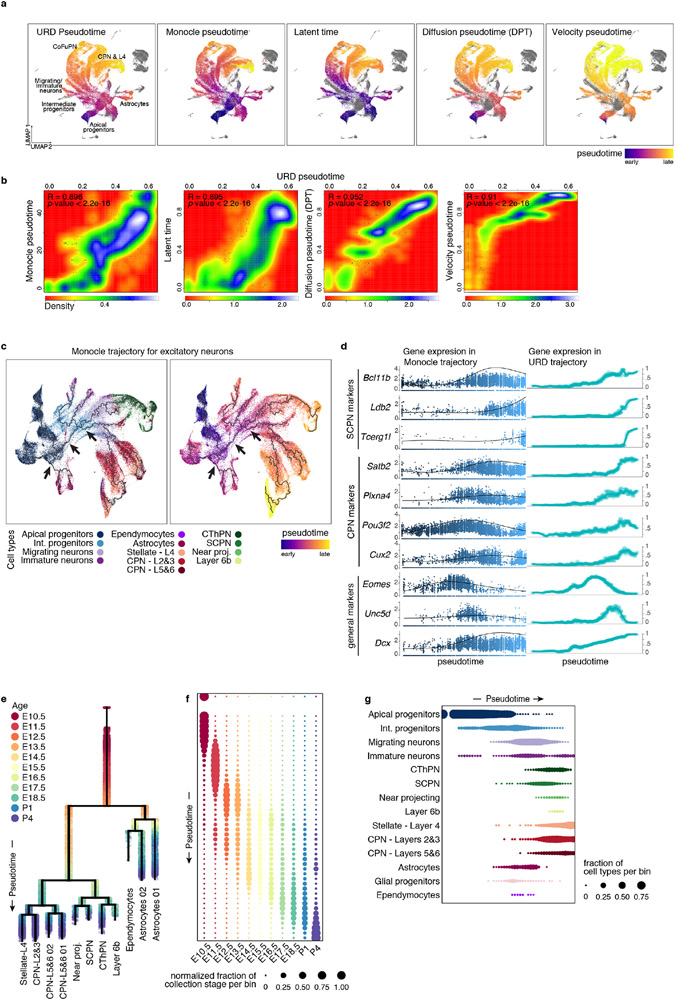
Extended Data Figure 4 (related to Figure 3). Consistent ordering of cells in developmental trajectories and characterization of branching tree of cortical development.
a UMAP visualizations of the scRNA-seq data from combined time points, with cells colored by pseudotime inferred by different methods. Left to right: URD pseudotime, Monocle3 pseudotime47, Latent time from sc-Velo45, Diffusion pseudotime (DPT)46, and Velocity pseudotime45. Purple represents earlier cells in the trajectory, while yellow labels later cells. Grey: cells that were excluded from the trajectory. b Correlation (red low and white high) for all cells between URD pseudotime values and pseudotime calculated by the specified method. R coefficient and p-value of the Pearson correlation is stated. c UMAP visualization of the cells used for trajectory building (same as cells used for Fig. 3a and related figures) colored by cell type (left) and pseudotime (right), on which a developmental trajectory was calculated using Monocle3. A similar branching structure was found. While it did not allow for finer segregation of the terminal neuronal types, Monocle3 ascribed a unique trajectory going from progenitors to all classes of neurons, with a post-mitotic branching into CPN and CFuPN branches (arrows, similar to URD). d Gene expression along trajectories calculated with URD (right) or Monocle3 (left).
e URD trajectory branching tree of the developing cortex. Cells are colored according to their developmental time of collection. f-g Normalized fraction of cells corresponding to each time point of collection (f) and to each cell type (g) across binned pseudotime, showing that pseudotime is aligned with age and cell type (compare to Fig.1c).

