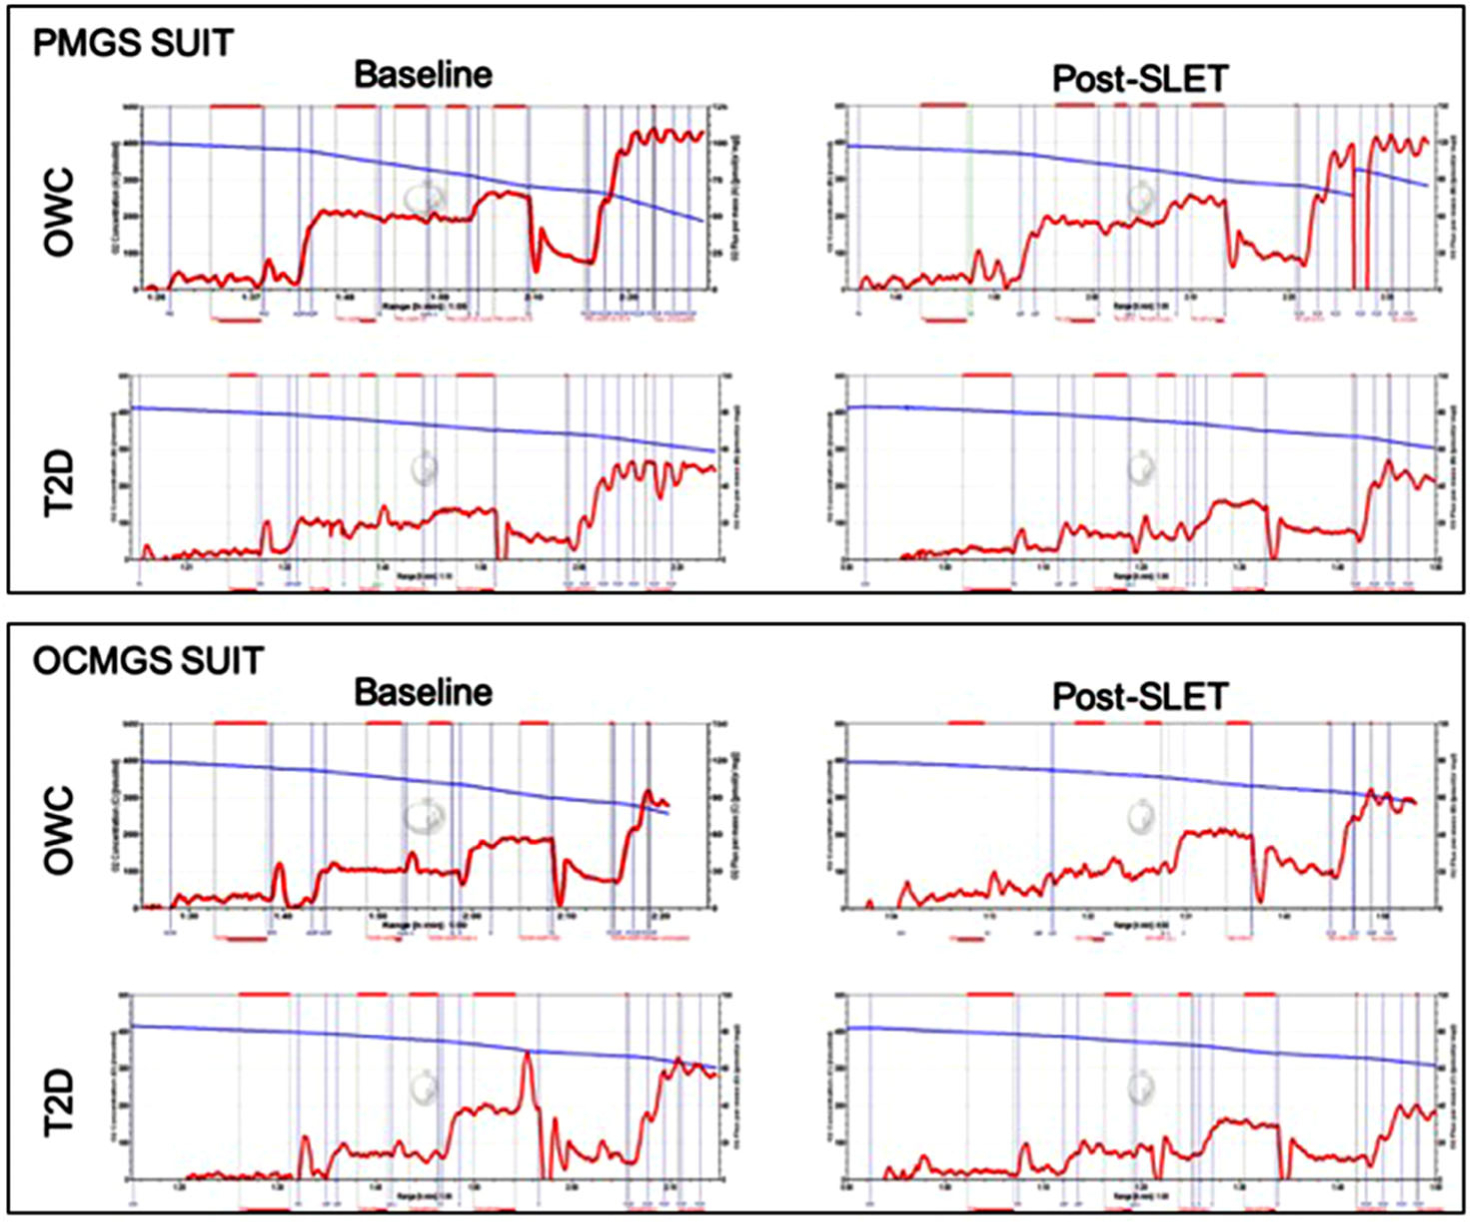
Figure 4. Representative tracings from ex vivo mitochondrial respiration measures.

Top: Data collected with the Pyruvate (P), Malate (M), Glutamate (G) and Succinate (S) SUIT measured at Baseline and following single-legged exercise training (SLET) in participants with (T2D) and without (OWC) type 2 diabetes. Bottom: Data collected with the Octanoylcarnitine (OC), Malate (M), Glutamate (G) and Succinate (S) SUIT measured at Baseline and following SLET in participants with (T2D) and without (OWC) type 2 diabetes. [Colour figure can be viewed at wileyonlinelibrary.com]
