
Figure 5. Skeletal muscle mitochondrial content.
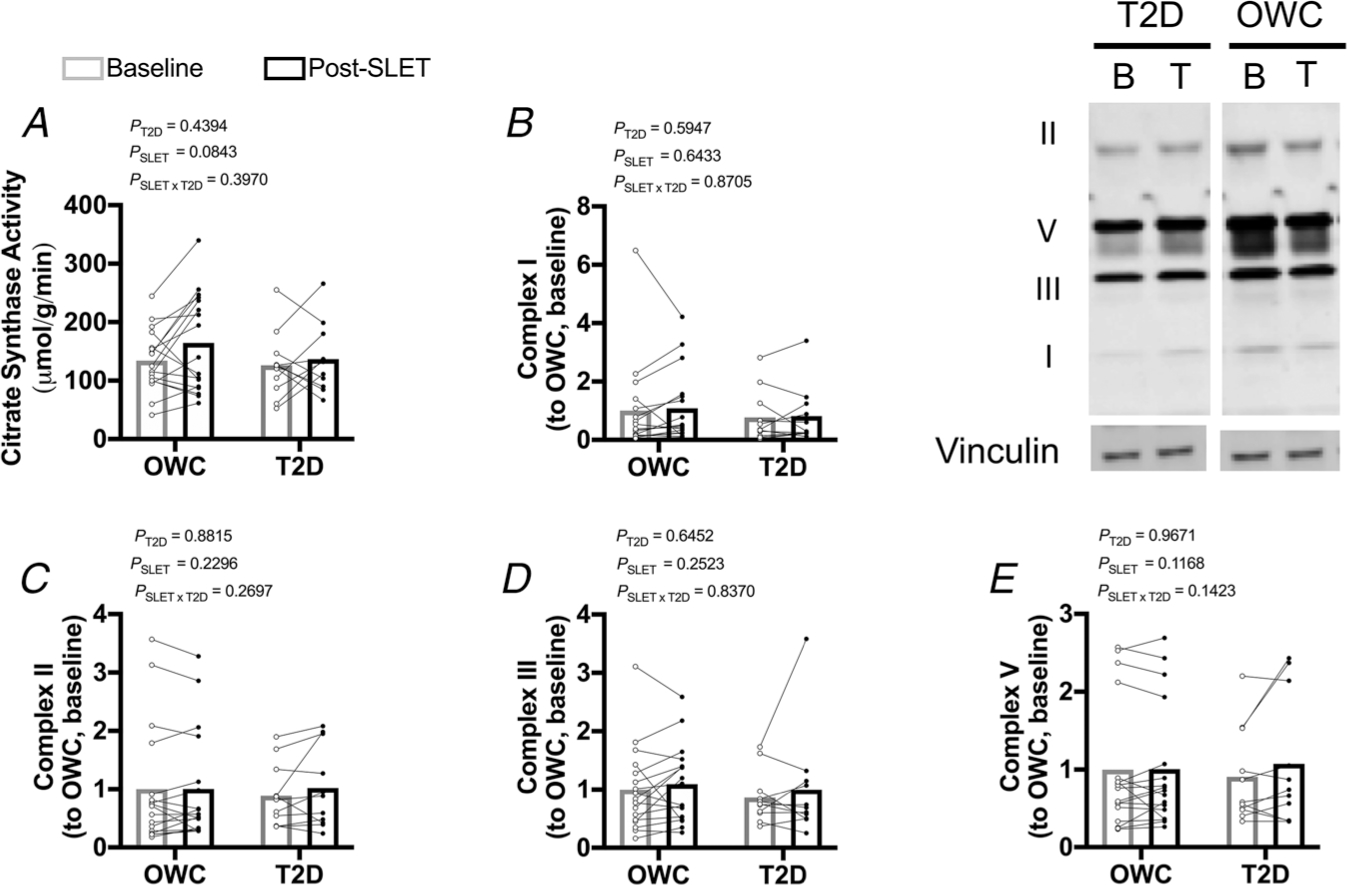
A, citrate synthase activity. B–E, protein content of mitochondrial complexes. Participants with overweight/obesity, without type 2 diabetes (T2D) (OWC; n =17). Participants with T2D (T2D; n =11). Single-leg exercise training (SLET). Baseline sample (B). Trained sample (T).