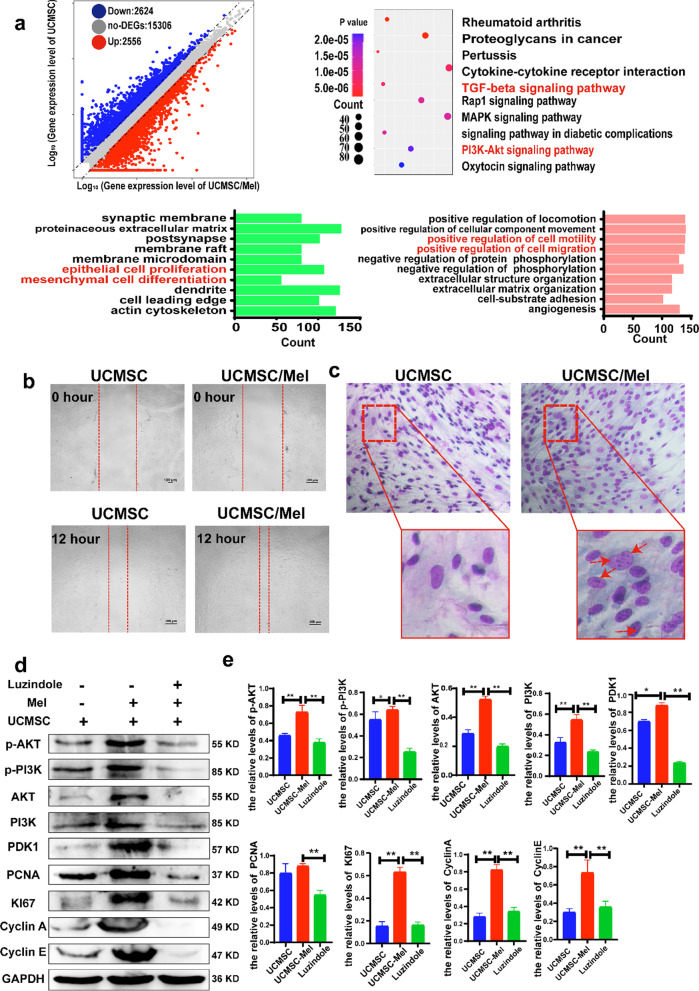
Fig. 3.
Identification of DEGs in UCMSCs and UCMSCs/Mel. a RNA sequence (volcano maps overall distribution of the differential genes; KEGG analysis and GO analysis. b Transwell migration assay. c Giemsa staining. d Western blot analysis of AKT, PI3K, PDK1, PCNA, KI67, Cyclin E and Cyclin A expression levels in hUC-MSCs treated with melatonin and melatonin receptor inhibitor (luzindole). GAPDH was used as a loading control. e Quantitative analysis of the western blot results. UCMSC (hUC-MSCs); Mel (melatonin). Data are mean ± SD; *P < 0.05; **P < 0.01; ***P < 0.001

