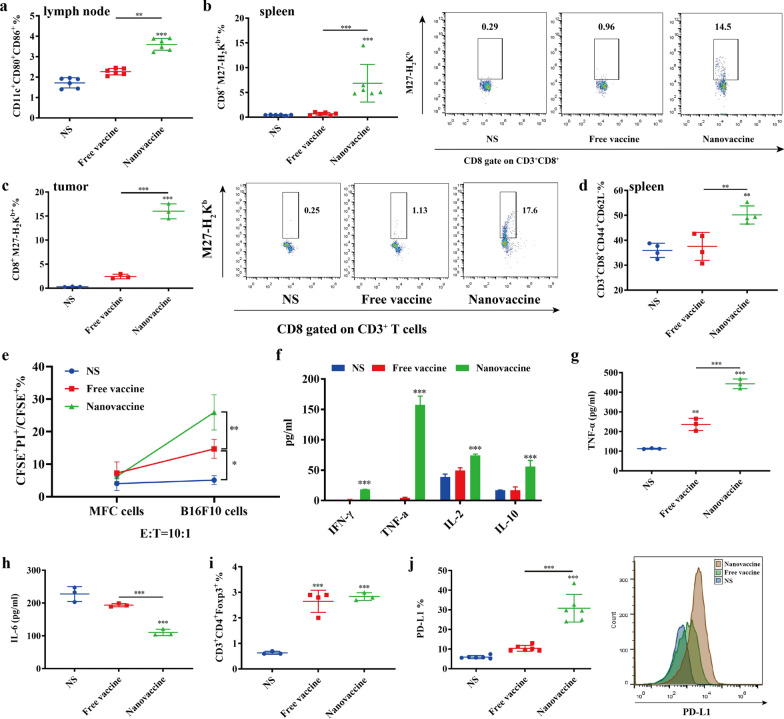
Fig. 5.
T cell responses activated by neoantigen nanovaccines. One week after last treatment, Proportions of mature DCs (CD11c+CD80+CD86+) in lymph nodes (a), proportions of neoantigen specific T cells (CD3+CD8+M27-H2Kb+) in spleens (b) and tumors (c), and proportions of effector memory T cells (CD3+CD8+CD44+CD62L−) in spleens (d) were analyzed by flow cytometry. P-values were determined by one-way ANOVA with Tukey’s multiple comparisons test. **P = 0.0034 (a), **P = 0.0026 (d, NS vs Nanovaccine), **P = 0.0056 (d, Free vaccine vs Nanovaccine), ***P < 0.001. e Lymphocytes in spleens were incubated with CFSE labeled B16F10 melanoma cells and MFC forestomach cancer cells at effector-to-target ratio (E: T) of 10:1. PI was added 4 h after incubation and the percentage of dead tumor cells (CFSE+PI+/ CFSE+) was analyzed by flow cytometry. P-values were determined by one-way ANOVA with Tukey’s multiple comparisons test. *P = 0.0114 (NS vs Free vaccine), **P = 0.0046 (Free vaccine vs Nanovaccine). f Cytokines in the supernatant after co-incubation of lymphocytes and tumor cells. P-values were determined by two-way ANOVA with Tukey’s HSD multiple comparison post hoc test. ***P < 0.001. The level of TNF-α (g) and IL-6 (h) in the tumor microenvironment. i Proportions of regulatory T cells (CD3+CD4+Foxp3+) in the tumor microenvironment. j The expression of PD-L1 in tumors. P-values were determined by one-way ANOVA with Tukey’s multiple comparisons test. **P = 0.0014 (g), ***P < 0.001

