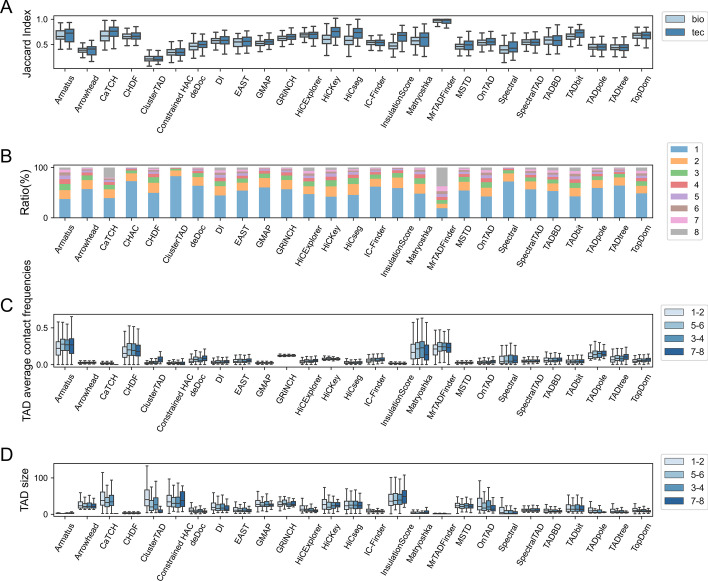
Fig. 7.
The evaluation of TAD boundaries statistically among the considered TAD callers between replicates over normalized human embryonic stem cell line Micro-C dataset at 5kb resolution, having the same sequencing depths. A TAD boundaries reproducibility between technical and biological replicates, as evaluated via Jaccard Index. B TAD count distribution relative to various reproducibility levels for individual TAD callers (Levels of reproducibility are between 8 and 1 from top to bottom). C The mean TAD interaction frequency across various TAD reproducibility levels between samples. D TAD sizes across various TAD reproducibility levels between samples

