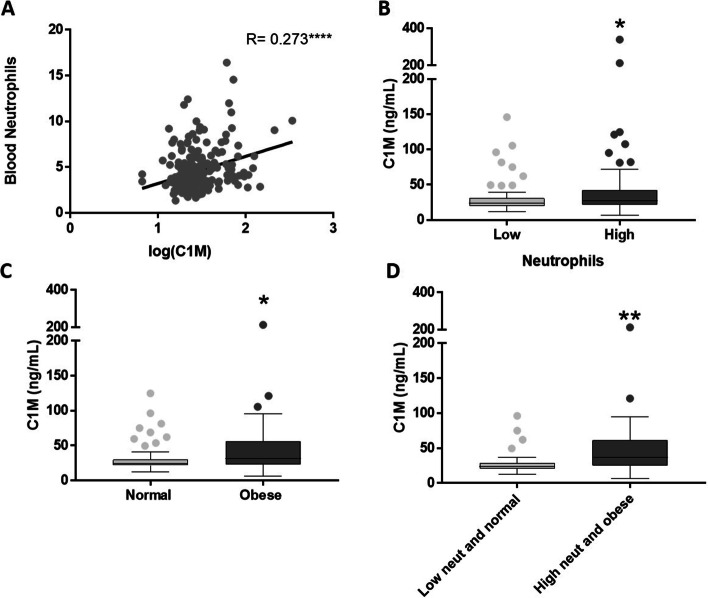
Fig. 4.
A Correlation between serum C1M level and blood neutrophils. Data were analysed using spearman’s correlation (r = 0.273, p < 0.0001). B Patients were stratified into high versus low blood neutrophils levels based on the median. C1M was significantly increased in patients with high neutrophil levels (n = 109) compared to low (n = 82) (p = 0.0154). C C1M was significantly increased in obese (BMI > 30) patients (n = 49) compared to normal-weight (BMI < 25) patients (n = 65) (p = 0.0137). D Obese asthmatics with high blood neutrophils (n = 33) had a significant increase in C1M compared to normal-weight asthmatics with low blood neutrophils (n = 36) (p = 0.0026). Data are presented as a Tukey box plot and analyzed using the Mann-Whitney test. Asterisks indicate statistically significance: *p < 0.05, **p < 0.01

