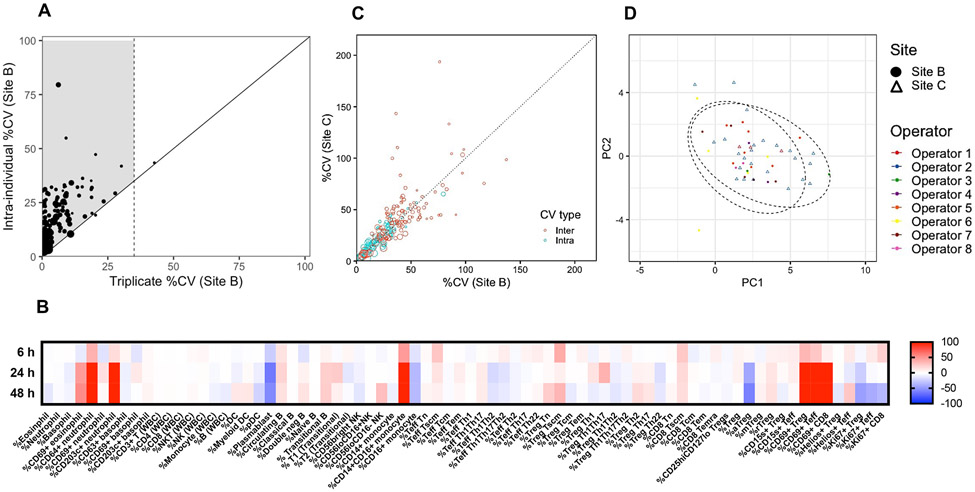
Figure 4. Flow cytometry standardization of five antibody panels using whole blood in the INNODIA multicenter study.
Stained blood samples from newly diagnosed (ND)-T1D donors collected in EDTA tubes were acquired on BD LSRFortessa flow cytometers with either five or three lasers at Sites B and C, respectively. Averaged intraindividual CV per parameter was determined using data at three time points0 (baseline, 3 and 6 months) from 13 and 21 ND-T1D subjects at Sites B and C, respectively. (A) Interindividual CV per parameter was determined using baseline data from the same cohorts. Technical variability (triplicate staining of three samples for all five flow panels) compared to biological intraindividual variability was assessed using averaged data from three samples. A total of 118 cell subset parameters were measured as depicted by each data point. Size of data point = mean frequency of each cell population (ranging in frequency of parent population from 0.03 to 93%). For samples to the right of the black diagonal line, technical and biological variability cannot be discriminated (i.e., >35% CV). Shaded area indicates biologically relevant immune subsets of interest with less than 35% technical CV and biological variability exceeding that of technical. (B) Two samples were stained at 0 (fresh), 6, 24, and 48 h after blood collection. Differences in frequencies of selected cell subsets (columns) were calculated for each time point compared to fresh values and data for the two samples were averaged, where red and blue indicate increased or decreased frequency, respectively. (C) Intra- and interindividual percent CV are compared between Sites B and C for N = 117 cell subsets. Size of data point = mean frequency of each cell population (ranging in frequency of parent population from 0.03 to 94%). (D) Complete baseline flow data from N = 24 and N = 27 samples from ND-T1D donors at Sites B and C, respectively, were used to perform PCA using base R functions and ggplot2 R packages in an unsupervised approach. Ellipse drawn assumed multivariate t-distribution at a level of 0.95 for each site (depicted by shape). Each operator is depicted by a color.

