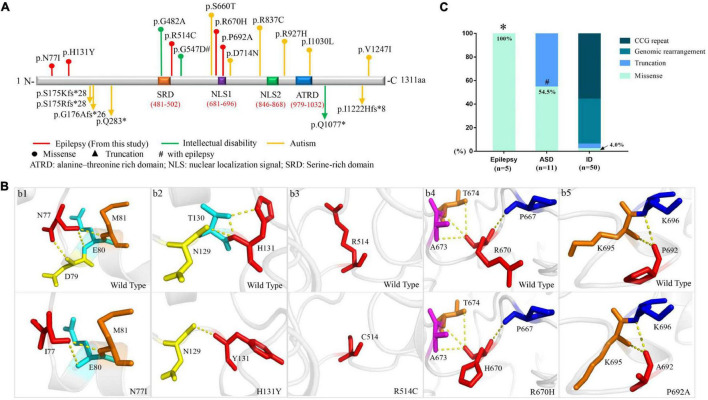
FIGURE 2.
Schematic presentation of FMR2 structure and genotype-phenotype correlation of AFF2. (A) Schematic diagram of missense and destructive AFF2 mutations and their locations on FMR2 protein. Missense mutations were shown at the top of the structural diagram. Destructive mutations were shown at the bottom. (B) Schematic illustration of the changes in hydrogen bonds. The residues where the mutations occurred are shown as red rods. The hydrogen bonds are shown as yellow spheres. (C) Genotypes of AFF2 in epilepsy, autism spectrum disorder (ASD), and intellectual disability (ID). *The proportion of missense mutations in epilepsy is significantly higher than that in ID (p < 0.001) through Fisher’s exact test. #The proportion of missense mutations in ASD is significantly higher than that in ID (p < 0.001) through Fisher’s exact test.

