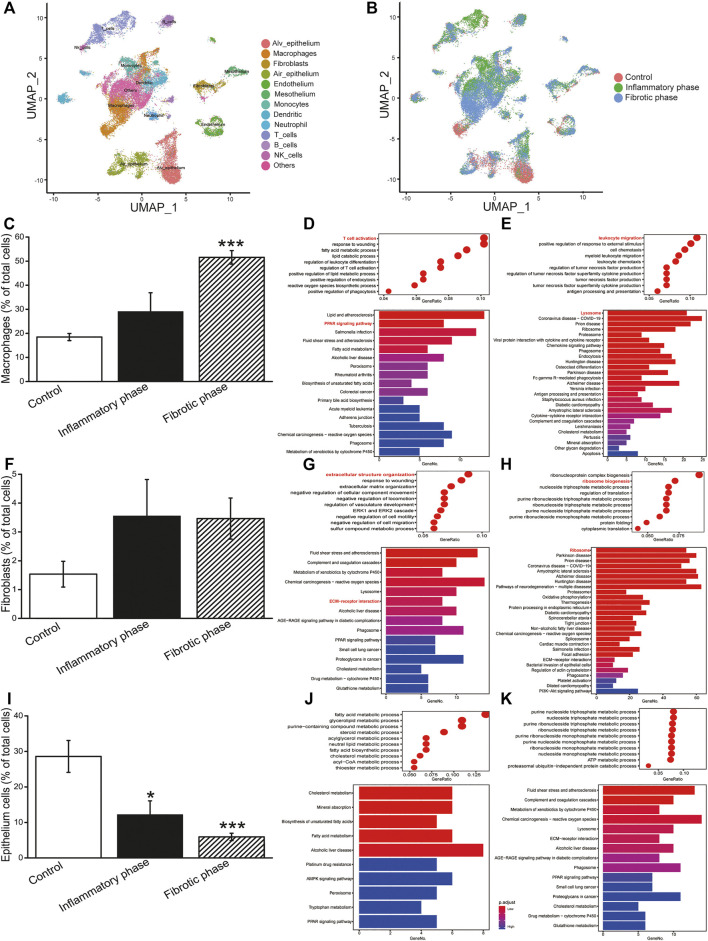
FIGURE 1.
ScRNA-seq analysis of BLM-induced PF. (A) Identified cell types in UMAP. (B) Cells split by inflammatory and fibrotic phases. (C) Percentage of macrophages. Bubble/bar plot showing GO/KEGG enrichment analysis results of the (D) downregulated and (E) upregulated genes in macrophages. (F) Percentage of fibroblasts. Bubble/bar plot showing GO/KEGG enrichment analysis results of the (G) downregulated and (H) upregulated genes in fibroblasts. (I) Percentage of epithelial cells. Bubble/bar plot showing GO/KEGG enrichment analysis results of the (J) downregulated and (K) upregulated genes in epithelial cells. *p < 0.05, ***p < 0.001, versus the control group, by the Mann–Whitney U test.

