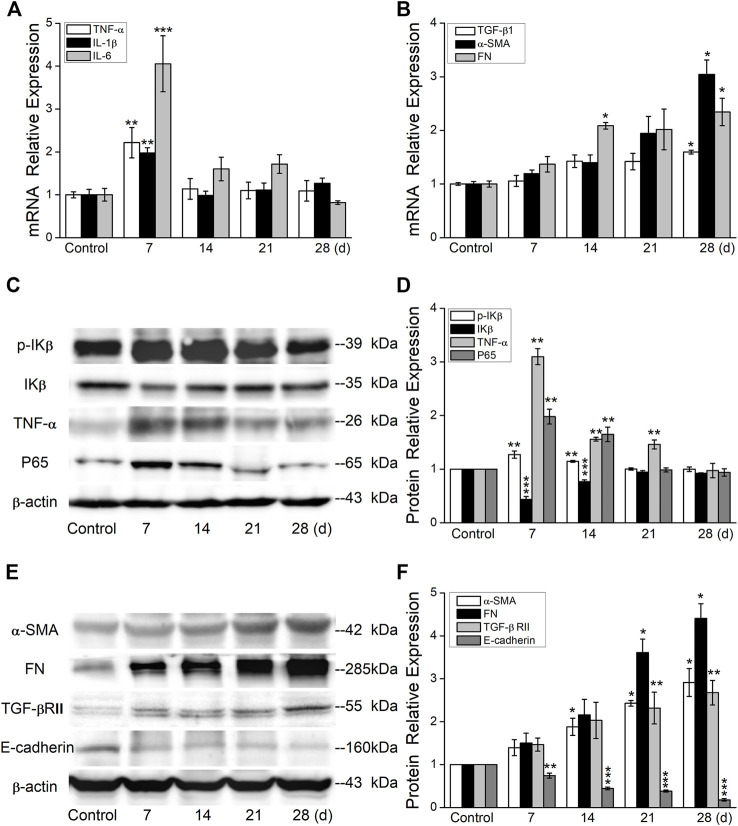
FIGURE 2.
BLM induces the expression of inflammation- and fibrosis-related protein. (A) qRT-PCR quantitation of mRNA expressions of inflammation-related genes. **p < 0.01, ***p < 0.001, -versus the control group, one-way ANOVA followed by Bonferroni’s test, n = 3–6. (B) qRT-PCR quantitation of mRNA expressions of fibrosis-related genes. *p < 0.05, versus the control group, by the Mann–Whitney U test, n = 3–6. (C-D) Representative and statistical data of inflammation-related proteins. **p < 0.01, ***p < 0.001, versus the control group, by the Mann–Whitney U test, n = 4–5. (E-F) Representative and statistical data of fibrosis-related proteins. *p < 0.05, **p < 0.01, ***p < 0.001, versus the control group, by the Mann–Whitney U test, n = 3–5.

