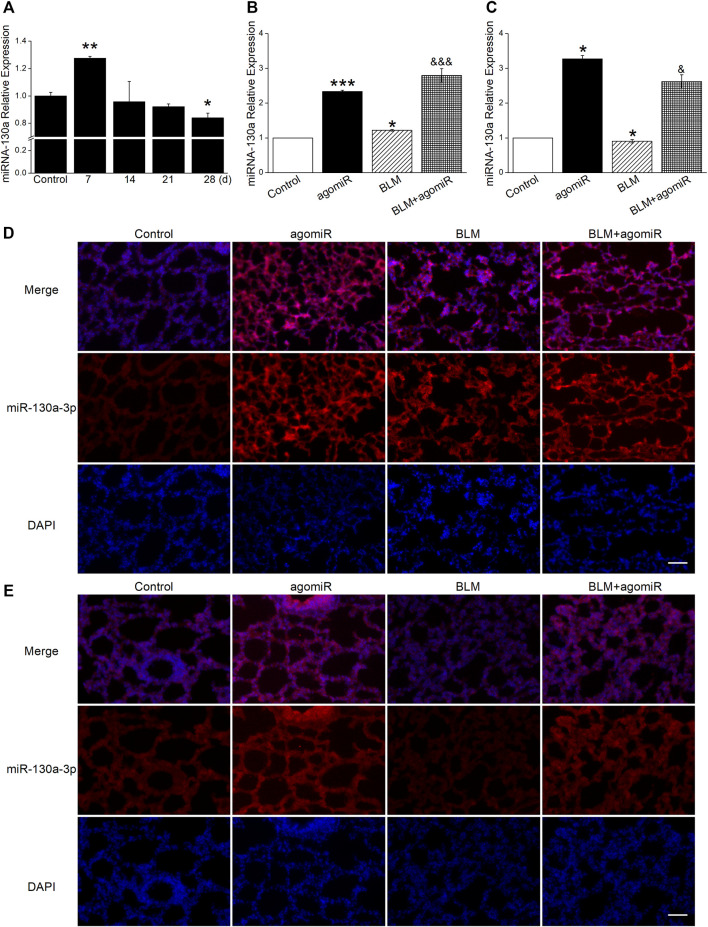
FIGURE 3.
MiR-130a-3p expression correlates with inflammatory and fibrotic phases. (A) qRT-PCR quantitation of miR-130a-3p expression at different times after BLM treatment. *p < 0.05, **p < 0.01, versus the control group, by the Mann–Whitney U test, n = 3–4. (B) qRT-PCR quantitation of miR-130a-3p expression in the inflammatory phase after BLM and/or miR-130a-3p agomiR treatment. *p < 0.05, ***p < 0.001, versus the control group; &&& p < 0.001, versus the BLM group, one-way ANOVA followed by Bonferroni’s test, n = 3–4. (C) qRT-PCR quantitation of miR-130a-3p expression in the fibrotic phase after BLM and/or miR-130a-3p agomiR treatment. *p < 0.05, versus the control group; & p < 0.05, versus the BLM group, by the Mann–Whitney U test, n = 4–5. FISH analysis of miR-130a-3p in lung tissues from the (D) inflammatory phase and (E) fibrotic phase. miR-130a-3p-positive (red) and DAPI (blue). Scale bar = 50 µm.

