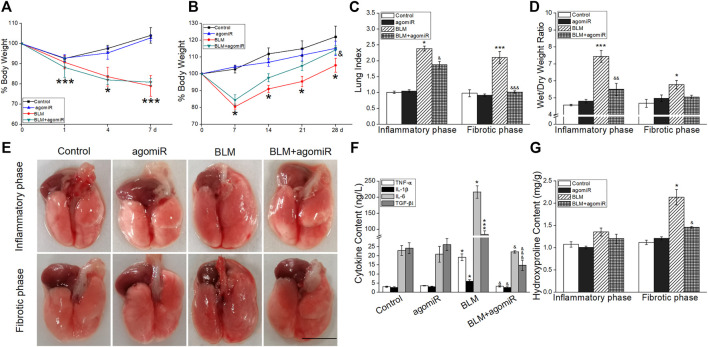
FIGURE 4.
Effect of miR-130a-3p agomiR on pulmonary inflammation and collagen deposition. (A-B) Mouse body weight changes in the course of the inflammatory phase or fibrotic phase after BLM induction. *p < 0.05, ***p < 0.001, versus the control group; & p < 0.05, versus the BLM group, by the Mann–Whitney U test, n = 3–5. (C) Lung index (%). (D) Wet/dry weight ratio. *p < 0.05, ***p < 0.001, versus the control group; & p < 0.05, && p < 0.01, &&& p < 0.001, versus the BLM group, one-way ANOVA followed by Bonferroni’s test, n = 3–5. (E) Representative photographs of whole lungs from all the experimental groups. Scale bar = 1 cm. (F) TNF-α, IL-1β, and IL-6 levels in BALF of the inflammatory phase. *p < 0.05, versus the control group; & p < 0.05, versus the BLM group, by the Mann–Whitney U test, n = 4–5. TGF-β1 level in BALF of the fibrotic phase. ***p < 0.001, versus the control group; &&& p < 0.001, versus the BLM group, one-way ANOVA followed by Bonferroni’s test, n = 4–5. (G) HYP levels in lung tissue of two phases. *p < 0.05, versus the control group; & p < 0.05, versus the BLM group, by the Mann–Whitney U test, n = 3–5.

