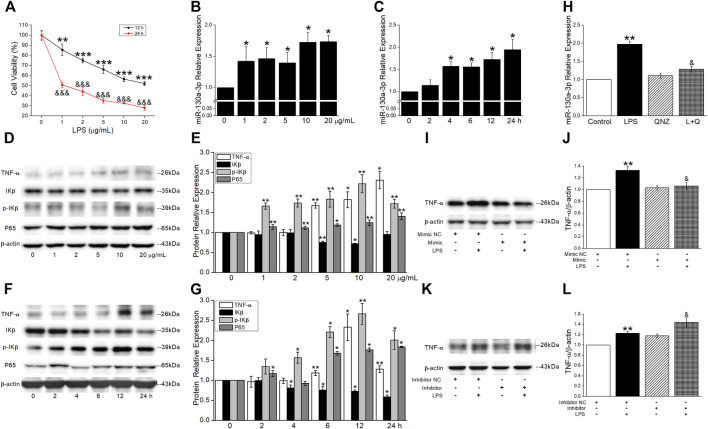
FIGURE 7.
MiR-130a-3p suppresses TNF-α production in the inflammatory phase. (A) Relative cell viability was measured by CCK-8 assay, and the data for 0 μg/ml were set to 100%. **p < 0.01, ***p < 0.001, versus 0 μg/ml (12 h); &&& p < 0.001, versus 0 μg/ml (24 h), one-way ANOVA followed by Bonferroni’s test, n = 3–4. (B-C) qRT-PCR quantitation of miR-130a-3p expression under concentration- and time-dependent LPS treatment. *p < 0.05, versus 0 μg/ml or 0 h, by the Mann–Whitney U test, n = 4. Representative and statistical data of NF-κB signal pathway protein levels under (D-E) concentration- and (F-G) time-dependent LPS treatment. p < 0.05, **p < 0.01, versus 0 μg/ml or 0 h, by the Mann–Whitney U test, n = 3–5. MH-S cells were treated with 11 nM of NF-κB inhibitor (QNZ) and 10 μg/ml of LPS for 12 h. (H) qRT-PCR quantitation of miR-130a-3p expression. **p < 0.01, versus the control group; & p < 0.05, versus the LPS group, by the Mann–Whitney U test, n = 4. (I-J) Representative and statistical data of TNF-α protein after LPS administration and/or miR-130a-3p mimic transfection. (K-L) Representative and statistical data of TNF-α protein after LPS administration and/or miR-130a-3p inhibitor transfection. **p < 0.01, versus the Mimic/Inhibitor NC group; & p < 0.05, versus the Mimic/Inhibitor NC + LPS group, by the Mann–Whitney U test, n = 4-7.

